Fig. 8.
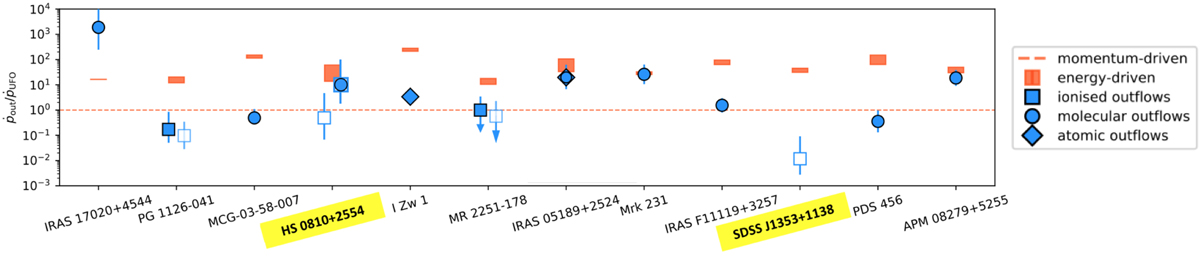
Ratio between the galaxy-scale and sub-pc scale outflow momentum rates for different QSOs hosting UFOs. Measurements for individual objects are shown in blue with the respective errorbars, using different markers according to the gas phase of the observed large scale outflow. The galaxy points are ordered by increasing LBol. The horizontal dashed line shows the prediction for a momentum-driven wind (ṗout/ṗUFO = 1), while the orange rectangles indicate the individual predictions for energy-driven winds. Filled and empty squares represent ionised outflow measurements based on Hα and [O III] emission, respectively. For HS 0810+2554, our [O III]-based measurement is shown both alone and combined with the CO-measurement of the molecular outflow (Chartas et al. 2020), with the respective symbol and combination of symbols (see the plot legend).
Current usage metrics show cumulative count of Article Views (full-text article views including HTML views, PDF and ePub downloads, according to the available data) and Abstracts Views on Vision4Press platform.
Data correspond to usage on the plateform after 2015. The current usage metrics is available 48-96 hours after online publication and is updated daily on week days.
Initial download of the metrics may take a while.