Free Access
Fig. 6.
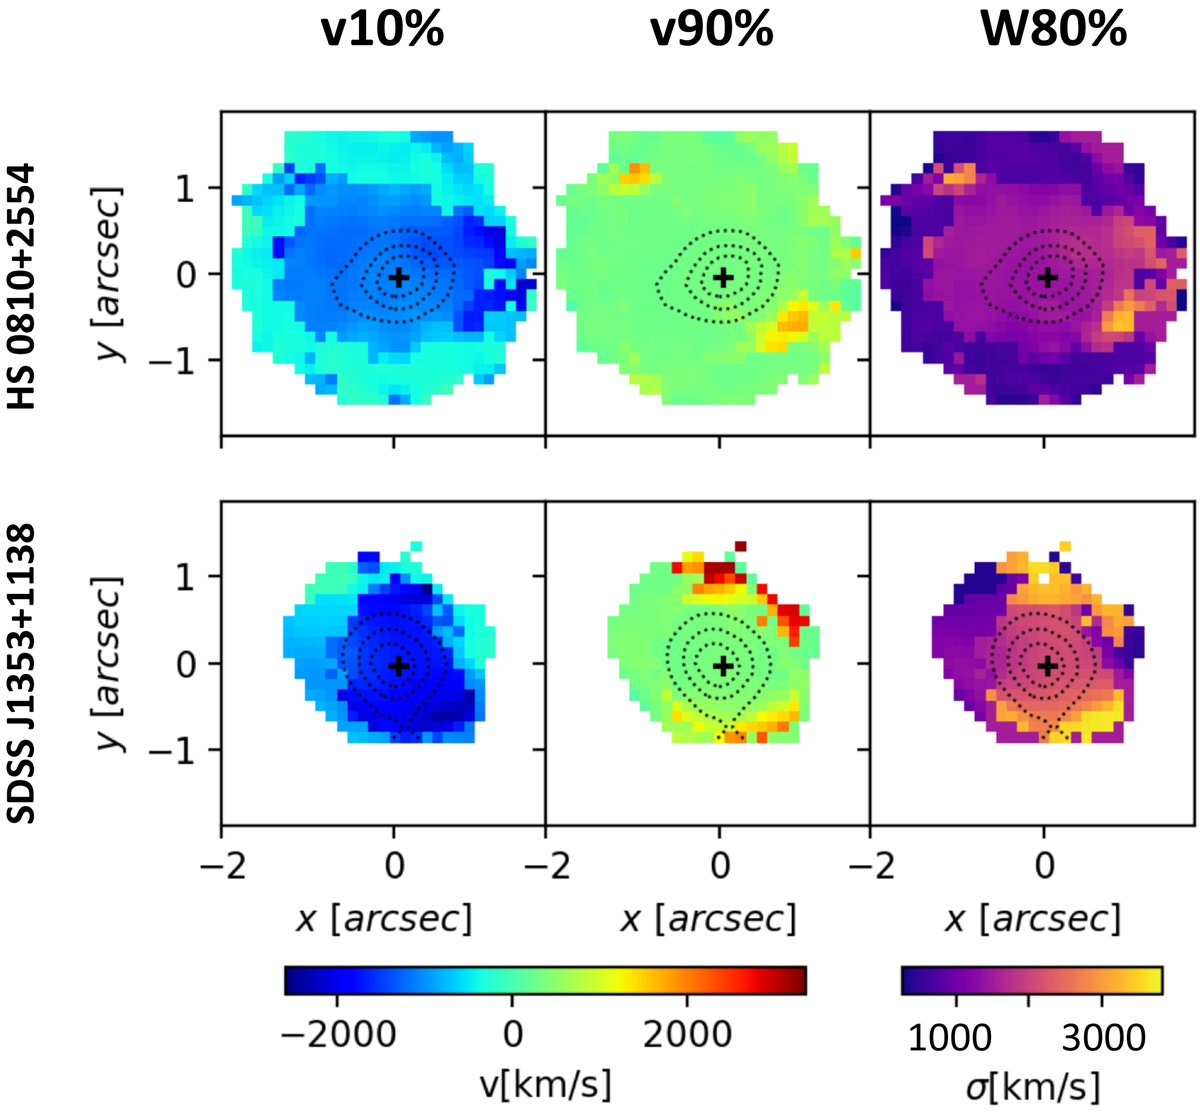
v10, v90, and W80 maps of the [O III] emission line in HS 0810+2554 (upper panels) and in SDSS J1353+1138 (lower panels). We applied the same cut in S/N as in the moment maps of Fig. 5, that is, with a S/N equal or higher than 2 and for HS 0810+2554 and higher than 3 for SDSS J1353+1138.
Current usage metrics show cumulative count of Article Views (full-text article views including HTML views, PDF and ePub downloads, according to the available data) and Abstracts Views on Vision4Press platform.
Data correspond to usage on the plateform after 2015. The current usage metrics is available 48-96 hours after online publication and is updated daily on week days.
Initial download of the metrics may take a while.