Fig. 4.
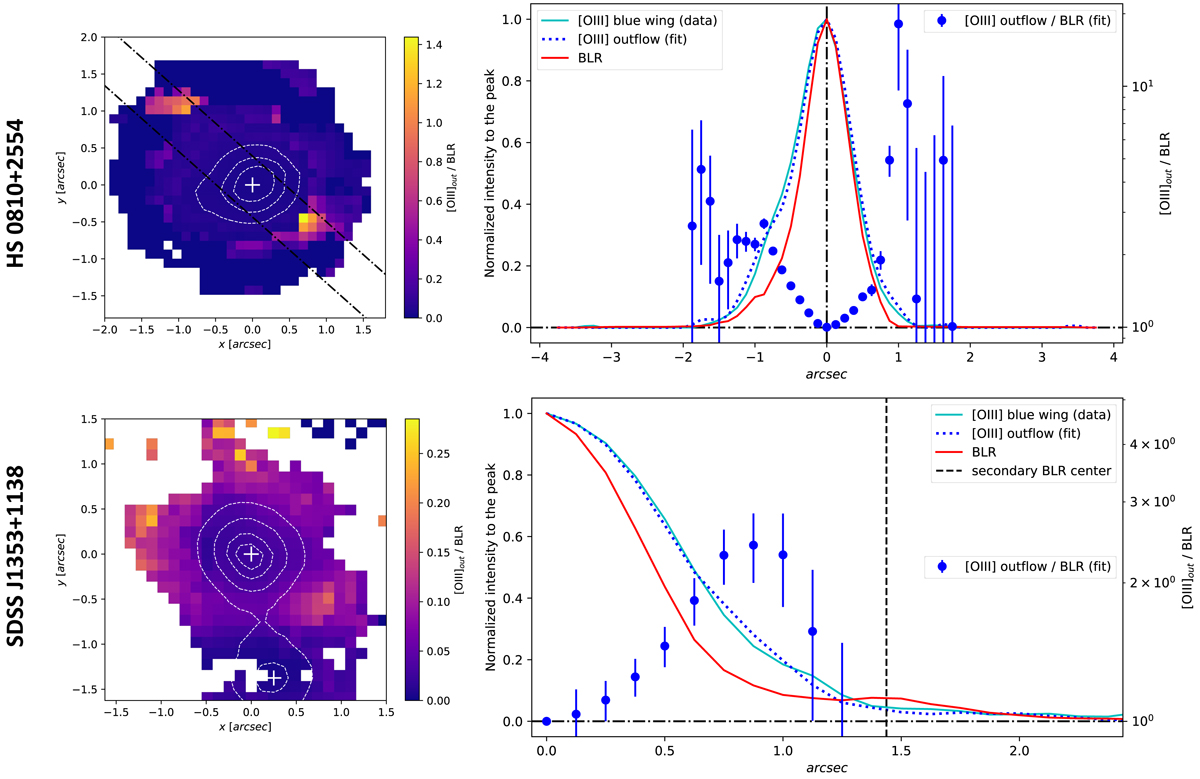
Spatially resolved ionised outflows in HS 0810+2554 (top) and in SDSS J1353+1138 (bottom). Left panels: maps of the ratio between the [O III] outflow flux and the BLR flux (both from best-fit models). Coloured pixels refer to a S/N ≳ 2 (S/N ≳ 3) on the full [O III] emission line (i.e., narrow + outflow components) for HS 0810+2554 (SDSS J1353+1138). The positions of the continuum emission peak of the lensed images are marked with white ‘+’, while the dotted white lines indicate the contour levels of the BLR emission at 75%, 50%, and 25% of its peak; for SDSS J1353+1138, it is represented also the level at 90%. Right panels: normalised intensity profiles along the pseudo-slit (black dotted-dashed lines in the ratio map) and in circular annuli of increasing radius for HS 0810+2554 (top) and SDSS J1353+1138 (bottom), respectively: BLR model (red lines), [O III] outflow model (dotted blue lines) and [O III] blue wing from data (cyan lines). Blue points represent ratio values of the [O III] outflow flux over the BLR flux and they are referred to the right-hand logarithmic scale. The dashed black line in the plot of SDSS J1353+1138 corresponds to the radial distance of the centre of image B.
Current usage metrics show cumulative count of Article Views (full-text article views including HTML views, PDF and ePub downloads, according to the available data) and Abstracts Views on Vision4Press platform.
Data correspond to usage on the plateform after 2015. The current usage metrics is available 48-96 hours after online publication and is updated daily on week days.
Initial download of the metrics may take a while.