Fig. 3.
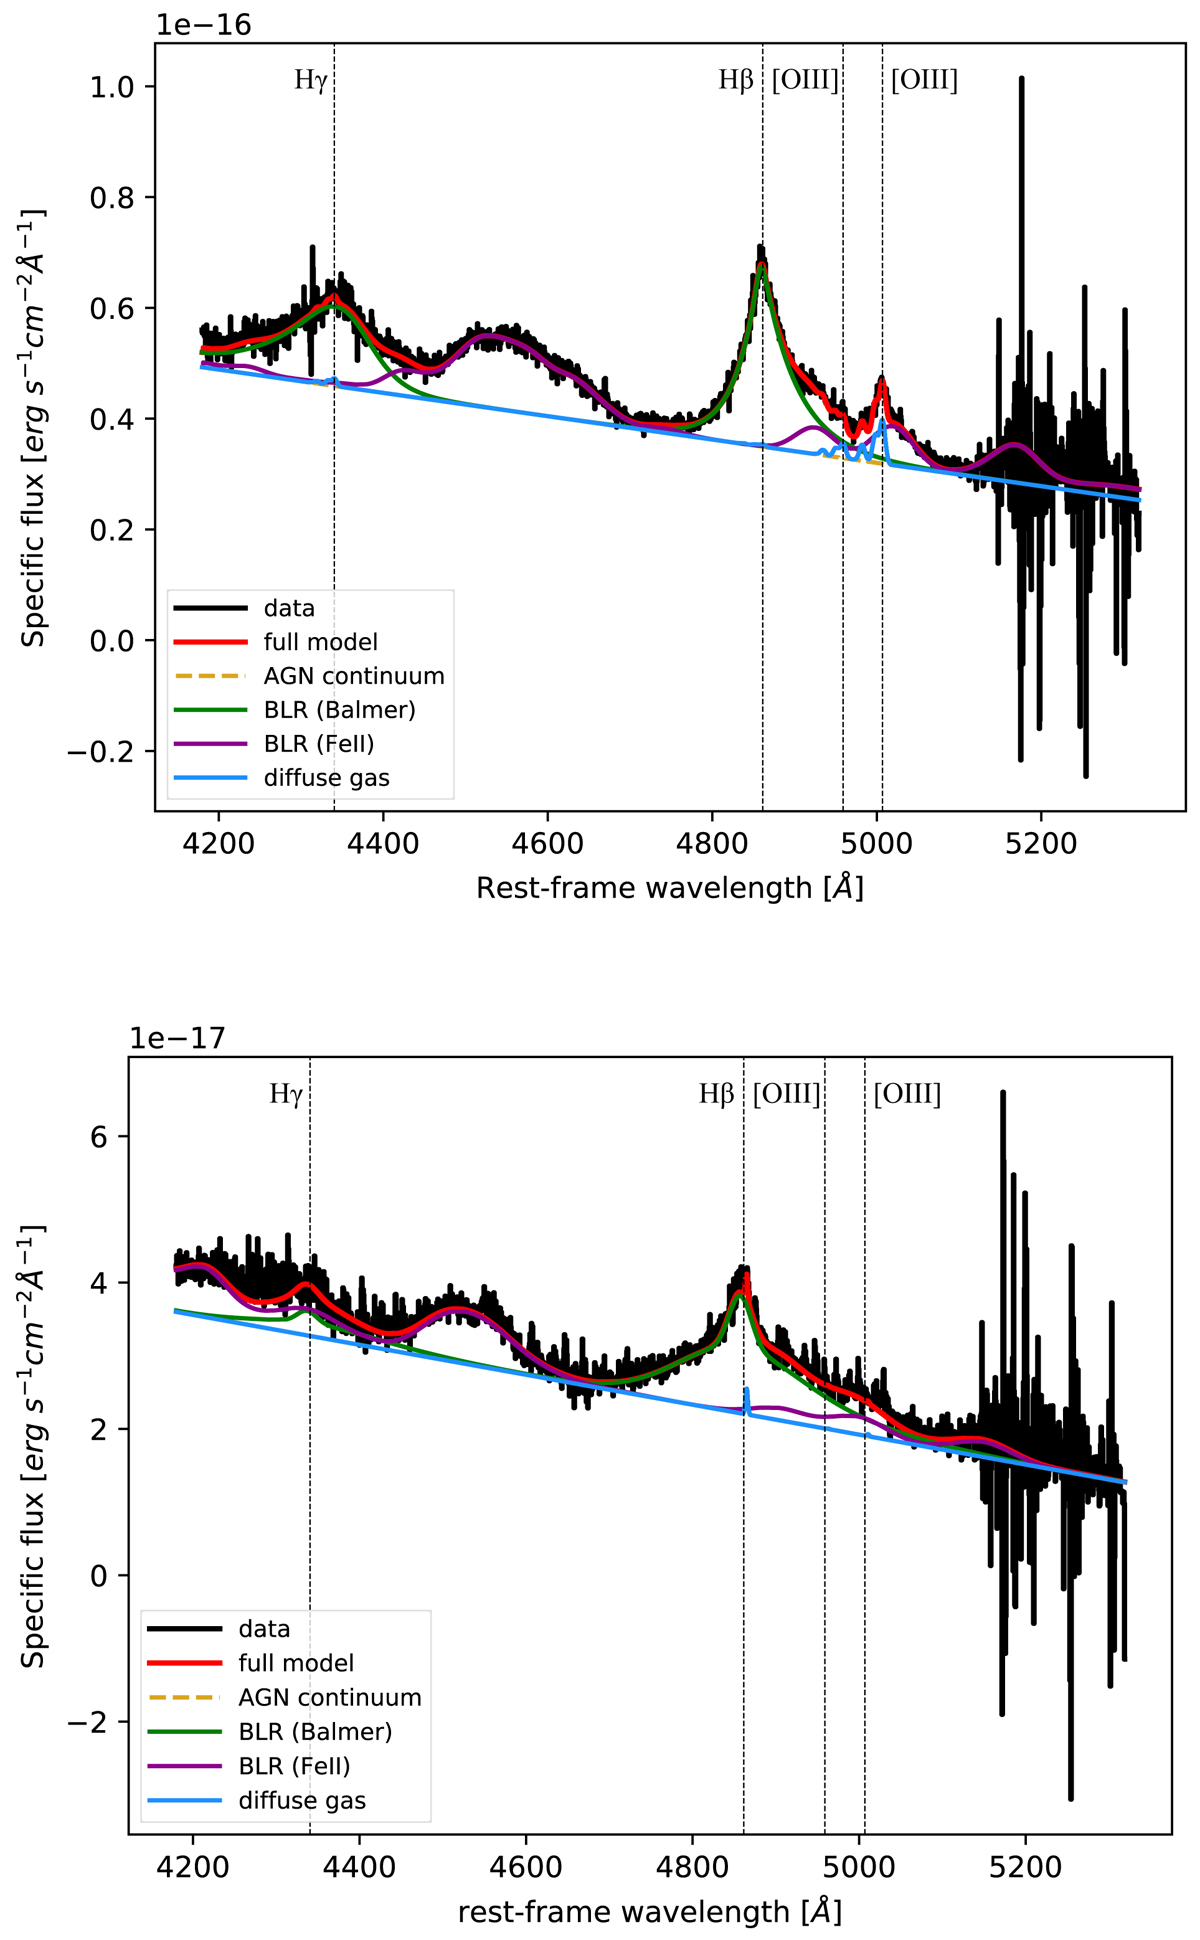
Best-fit models of nuclear spectra of SDSS J1353+1138 extracted from an aperture of ![]() radius, centred on image A (upper panel) and on image B (lower panel). The various spectral components, the total model and data are represented with different colours (see the plot legend). In spectrum A, a broken power law distribution is perfectly suited to reproduce the BLR–Hβ profile, while in spectrum B, an additional broad Gaussian component was required to adequately reproduce the broad peak in the BLR–Hβ line profile, which is entirely dominant over the barely detected Hβ narrow component (solid light-blue line). The two spectra clearly differ from each other mostly for the lack of [O III] detection and the presence of a prominent blue wing in the Hβ line profile in spectrum B.
radius, centred on image A (upper panel) and on image B (lower panel). The various spectral components, the total model and data are represented with different colours (see the plot legend). In spectrum A, a broken power law distribution is perfectly suited to reproduce the BLR–Hβ profile, while in spectrum B, an additional broad Gaussian component was required to adequately reproduce the broad peak in the BLR–Hβ line profile, which is entirely dominant over the barely detected Hβ narrow component (solid light-blue line). The two spectra clearly differ from each other mostly for the lack of [O III] detection and the presence of a prominent blue wing in the Hβ line profile in spectrum B.
Current usage metrics show cumulative count of Article Views (full-text article views including HTML views, PDF and ePub downloads, according to the available data) and Abstracts Views on Vision4Press platform.
Data correspond to usage on the plateform after 2015. The current usage metrics is available 48-96 hours after online publication and is updated daily on week days.
Initial download of the metrics may take a while.