Fig. 2.

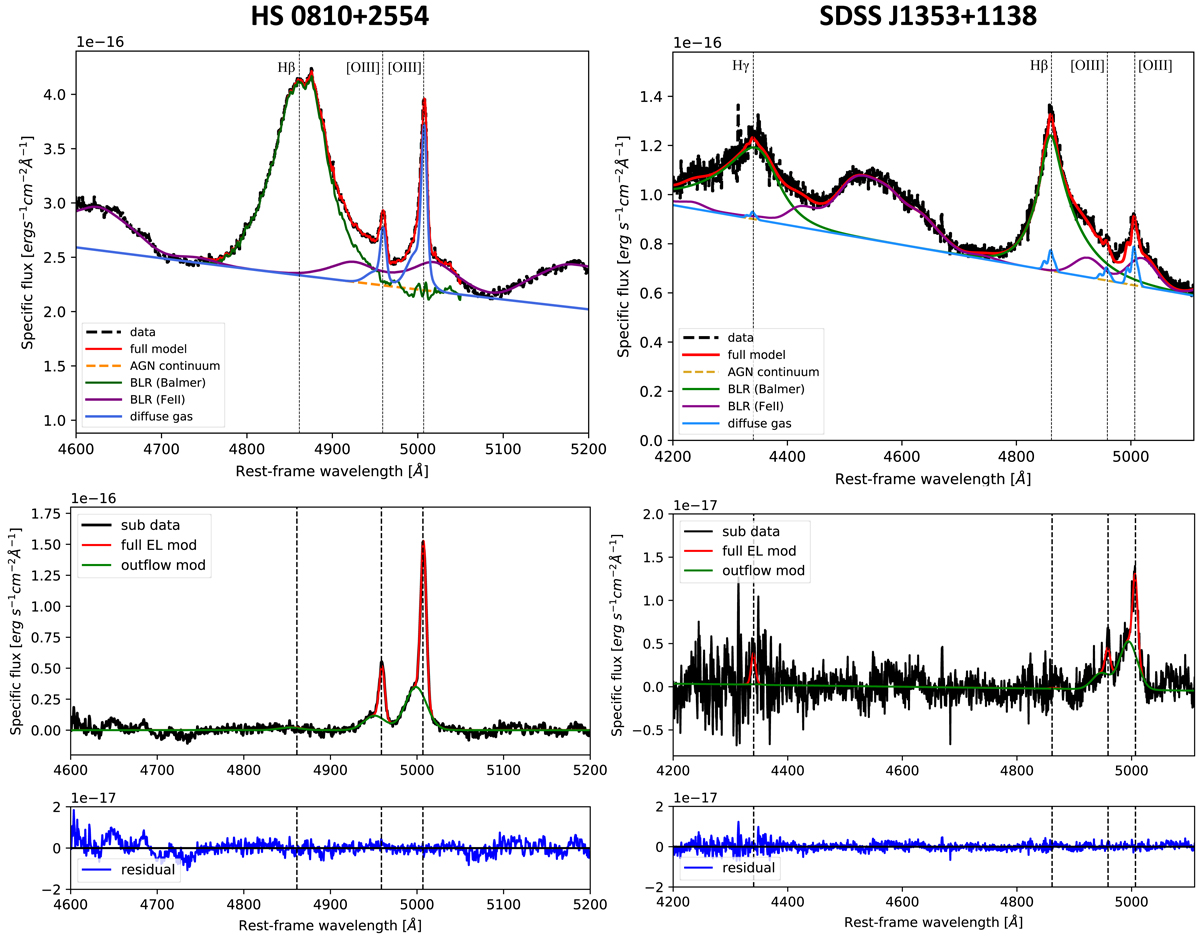
Representative scheme of our fitting procedure. Top panels: SINFONI J-band spectra of HS 0810+2554 (left) and SDSS J1353+1138 (right), zoomed in the spectral region of [O III] and Balmer hydrogen emission lines. Both spectra were extracted using an aperture of ![]() -radius, centred on the peak of the AGN continuum emission (located on image A in SDSS J1353+1138). Black dashed lines show the data, while red solid lines show the best-fit models obtained in phase II of our analysis. The latter is partitioned into the contributions of various components: AGN continuum (yellow), BLR emission in Balmer hydrogen emission lines (green) and Fe II (purple), and narrow line emission from the diffuse gas (light blue) represented as sum of multiple Gaussian components. Middle panels: J-band spectra extracted from the subtracted cubes, with the same aperture used in the top panels. Subtracted data (black lines) are compared to the best-fit models (red lines) resulting from the finer emission lines (EL) modelling implemented in phase III. The green lines highlight the outflow component alone. Bottom panels: residuals obtained by subtracting the full EL model from the subtracted spectra.
-radius, centred on the peak of the AGN continuum emission (located on image A in SDSS J1353+1138). Black dashed lines show the data, while red solid lines show the best-fit models obtained in phase II of our analysis. The latter is partitioned into the contributions of various components: AGN continuum (yellow), BLR emission in Balmer hydrogen emission lines (green) and Fe II (purple), and narrow line emission from the diffuse gas (light blue) represented as sum of multiple Gaussian components. Middle panels: J-band spectra extracted from the subtracted cubes, with the same aperture used in the top panels. Subtracted data (black lines) are compared to the best-fit models (red lines) resulting from the finer emission lines (EL) modelling implemented in phase III. The green lines highlight the outflow component alone. Bottom panels: residuals obtained by subtracting the full EL model from the subtracted spectra.
Current usage metrics show cumulative count of Article Views (full-text article views including HTML views, PDF and ePub downloads, according to the available data) and Abstracts Views on Vision4Press platform.
Data correspond to usage on the plateform after 2015. The current usage metrics is available 48-96 hours after online publication and is updated daily on week days.
Initial download of the metrics may take a while.


