Open Access
Fig. 8.
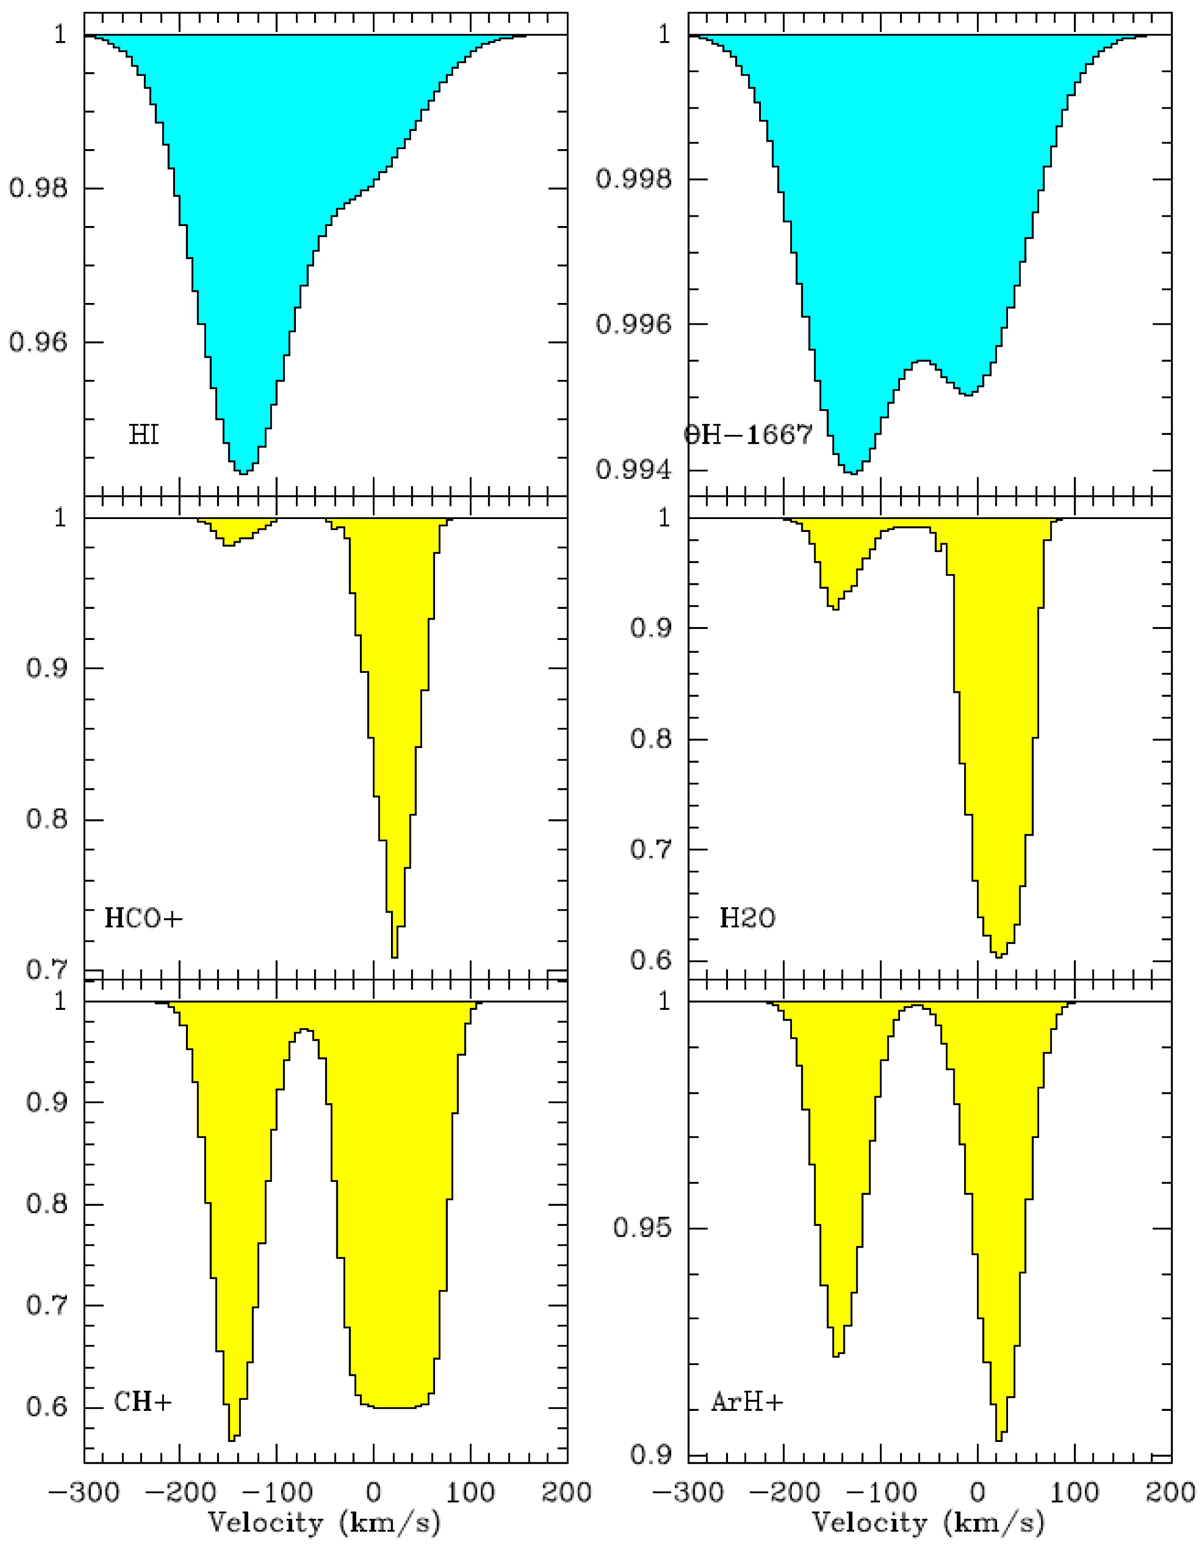
Absorption line profiles derived from the model: the global spectrum has been computed over the whole continuum map, (top) for the H I and OH lines, (middle) the HCO+ and H2O lines, and (bottom) for the CH+ and ArH+ lines. The spectra are normalized with the total continuum level (NE+SW+Einstein ring).
Current usage metrics show cumulative count of Article Views (full-text article views including HTML views, PDF and ePub downloads, according to the available data) and Abstracts Views on Vision4Press platform.
Data correspond to usage on the plateform after 2015. The current usage metrics is available 48-96 hours after online publication and is updated daily on week days.
Initial download of the metrics may take a while.