Fig. 6.
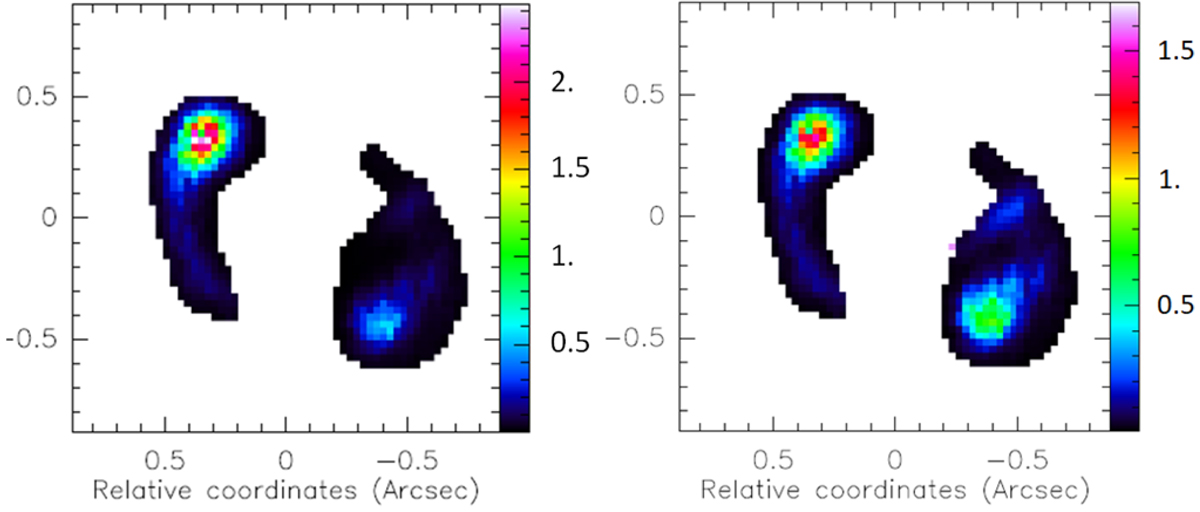
Maps of the product (arbitrary units) between the MERLIN continuum intensity and the optical depth from the galaxy model: left: for the H I line, where a central depletion was assumed for the best fit and right: for the OH-1667 MHz line, with a more concentrated distribution. The axes are labeled in arcseconds. We note a big difference in the SW component.
Current usage metrics show cumulative count of Article Views (full-text article views including HTML views, PDF and ePub downloads, according to the available data) and Abstracts Views on Vision4Press platform.
Data correspond to usage on the plateform after 2015. The current usage metrics is available 48-96 hours after online publication and is updated daily on week days.
Initial download of the metrics may take a while.