Fig. 5.
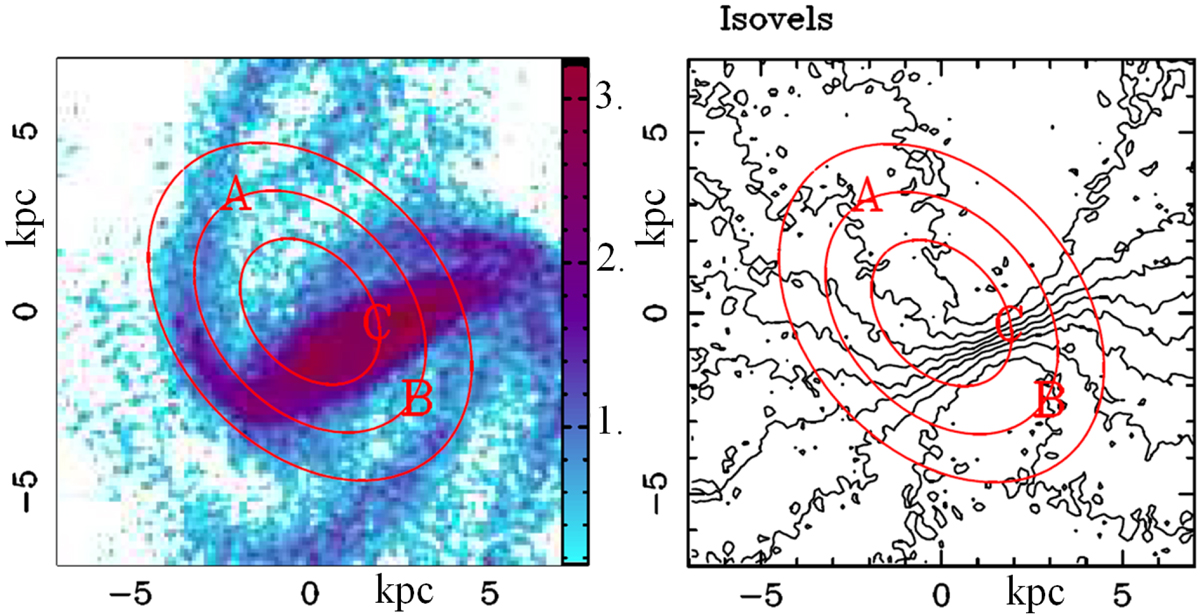
Galaxy model adopted from an N-body simulation snapshot: left: gas surface density projected on the sky with an inclination of 26° and PA = 15°, and right: corresponding gas isovelocity curves separated by 24.3 km s−1 and ranging from −109.4 km s−1 to +109.4 km s−1. The locations of NE image (A), SW image (B), and a third central image (C) close to the lensing-galaxy center are indicated together with the schematic contours of the Einstein ring, which are conspicuous at cm wavelengths.
Current usage metrics show cumulative count of Article Views (full-text article views including HTML views, PDF and ePub downloads, according to the available data) and Abstracts Views on Vision4Press platform.
Data correspond to usage on the plateform after 2015. The current usage metrics is available 48-96 hours after online publication and is updated daily on week days.
Initial download of the metrics may take a while.