Fig. 4.
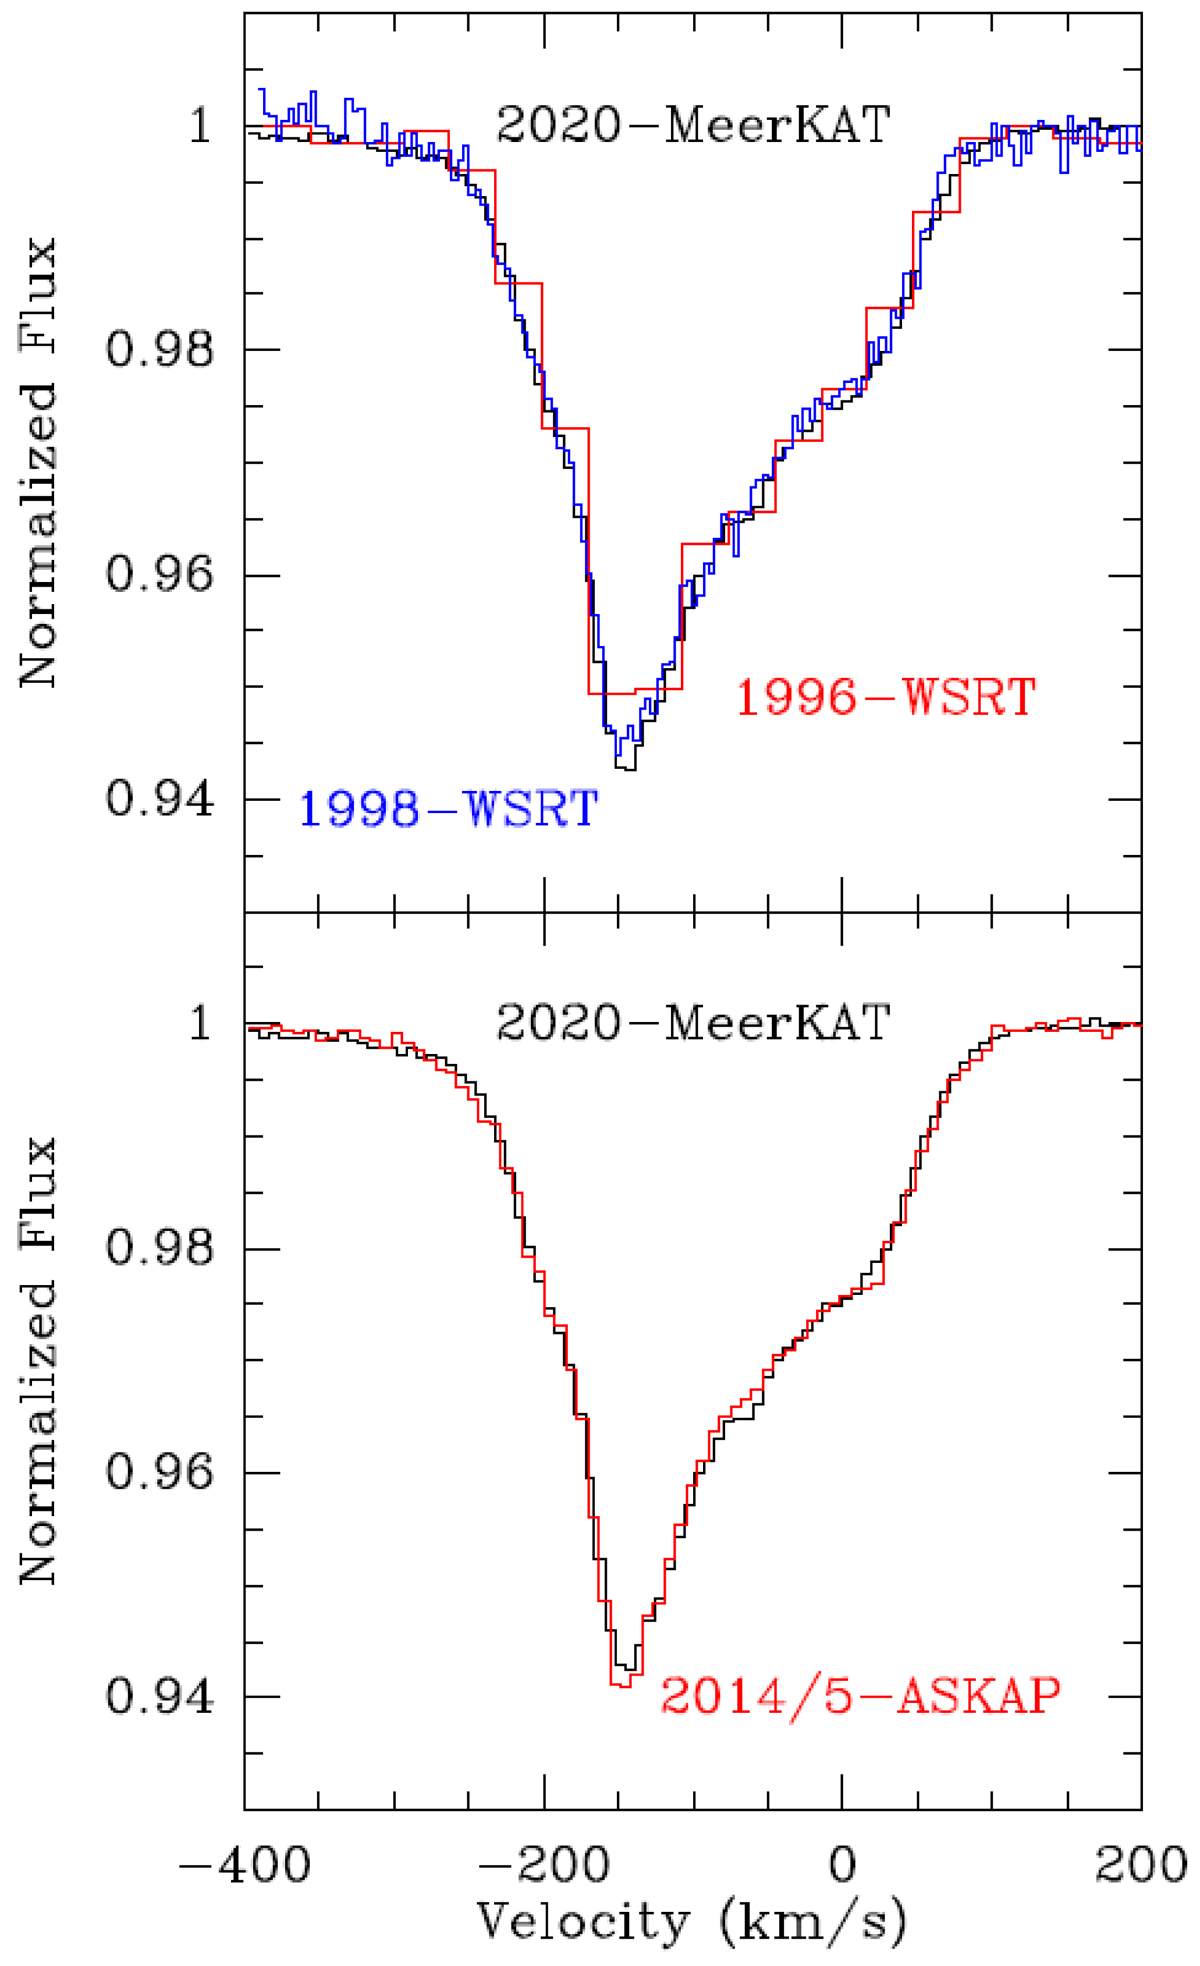
Top: MeerKAT H I spectrum (black) taken on July 13, 2020, compared to the H I spectrum (red) observed on November 3, 1996, by Chengalur et al. (1999), and the one (blue) observed on October 25, 1998, by Koopmans & de Bruyn (2005), both with the WSRT. Bottom: MeerKAT H I spectrum (black), taken on July 13, 2020, compared to the H I average ASKAP spectrum (red) observed in July 2014 and July–October 2015 by Allison et al. (2017). All spectra have been normalized to their observed continuum.
Current usage metrics show cumulative count of Article Views (full-text article views including HTML views, PDF and ePub downloads, according to the available data) and Abstracts Views on Vision4Press platform.
Data correspond to usage on the plateform after 2015. The current usage metrics is available 48-96 hours after online publication and is updated daily on week days.
Initial download of the metrics may take a while.