Fig. 2.
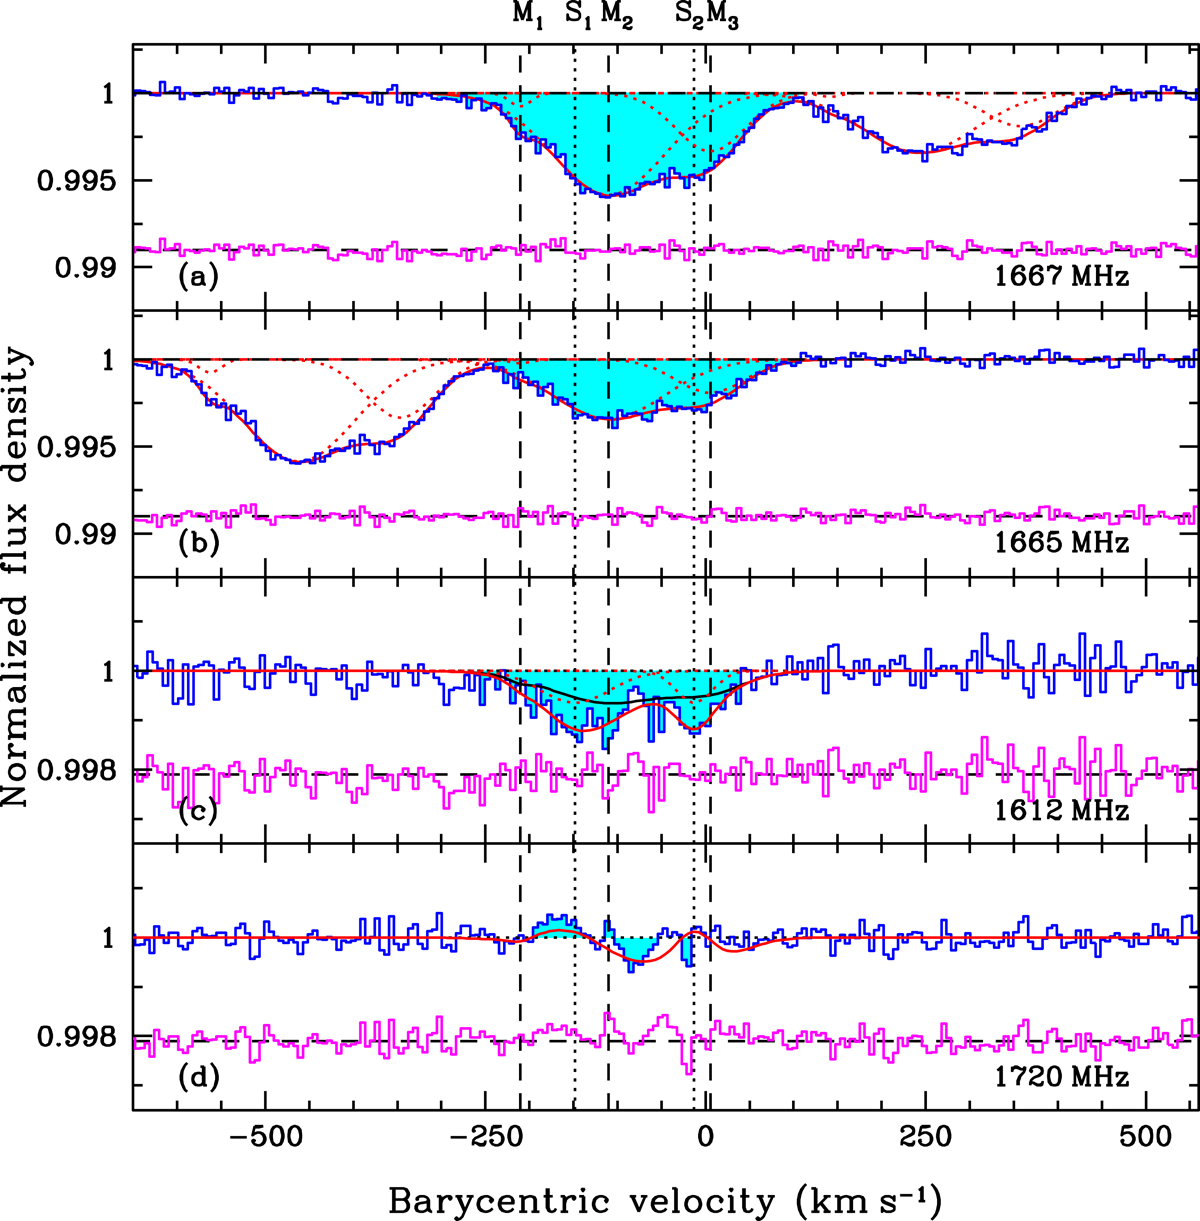
MeerKAT Stokes-I spectrum (blue) of OH 18 cm lines at z = 0.89 towards PKS 1830−211. The velocity scale is defined with respect to z = 0.88582. The spectral rms in the region close to the 1667 MHz line is 2.9 mJy beam−1 per 6.1 km s−1 channel. The vertical dashed and dotted lines (black) represent the locations of the individual Gaussian components fitted to the absorption in main lines (M1, M2, and M3; dotted red lines in (a) and (b)) and the excess absorption in the 1612 MHz satellite line (S1 and S2; dotted lines in (c); also see Table 1), respectively. The black solid line in panel c represents the absorption profile predicted under LTE due to M1, M2, and M3. The difference between the red and black solid lines represents the maser contribution due to pumping, and is conjugate with the 1720 MHz line in (d): at V = −170 km s−1, the 1720 MHz line is in emission and 1612 MHz in absorption, while at V = −80 km s−1, the 1720 MHz is in absorption, and the 1612 MHz in emission. In all the panels, the total fit and the residuals, which are arbitrarily offset for clarity, are plotted as solid lines in red and magenta, respectively.
Current usage metrics show cumulative count of Article Views (full-text article views including HTML views, PDF and ePub downloads, according to the available data) and Abstracts Views on Vision4Press platform.
Data correspond to usage on the plateform after 2015. The current usage metrics is available 48-96 hours after online publication and is updated daily on week days.
Initial download of the metrics may take a while.