Fig. A.1.
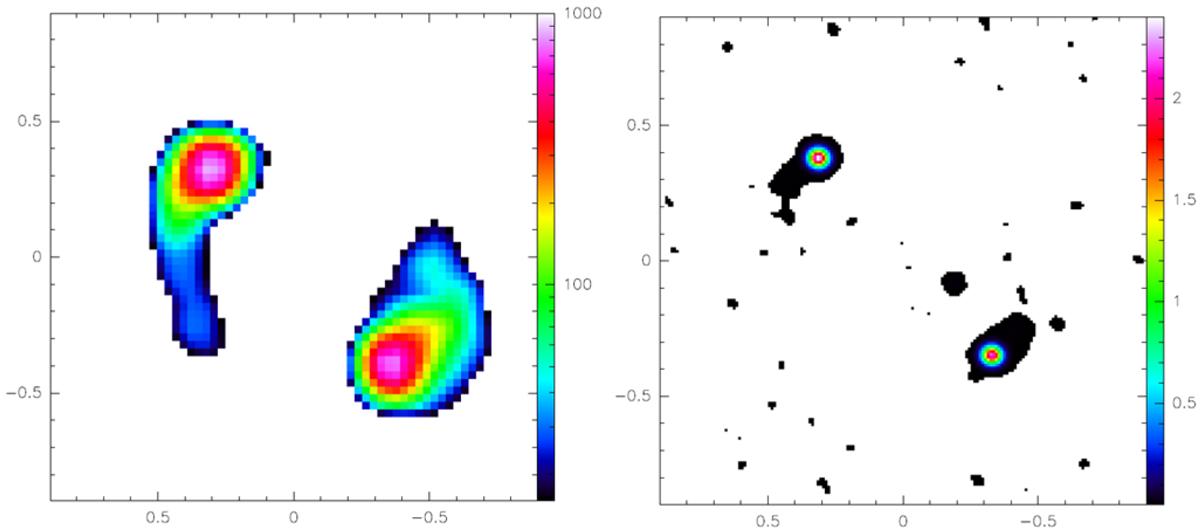
Continuum maps of PKS 1830−211, used in the kinematical models: Left: continuum emission at 5 GHz with synthesized beam of 0.1″ (pixel size = 0.028″) measured by the MERLIN interferometer (Patnaik et al. 1993) and used for the H I and OH spectra (color wedge in mJy beam−1). Right: continuum emission in Band 5 (∼180 GHz) of ALMA (Muller et al. 2020), with beam 0.056″ (pixel size = 0.014″), used for HCO+ and H2O lines (color wedge in Jy beam−1). The axes are labeled in arcseconds.
Current usage metrics show cumulative count of Article Views (full-text article views including HTML views, PDF and ePub downloads, according to the available data) and Abstracts Views on Vision4Press platform.
Data correspond to usage on the plateform after 2015. The current usage metrics is available 48-96 hours after online publication and is updated daily on week days.
Initial download of the metrics may take a while.