Fig. 1.
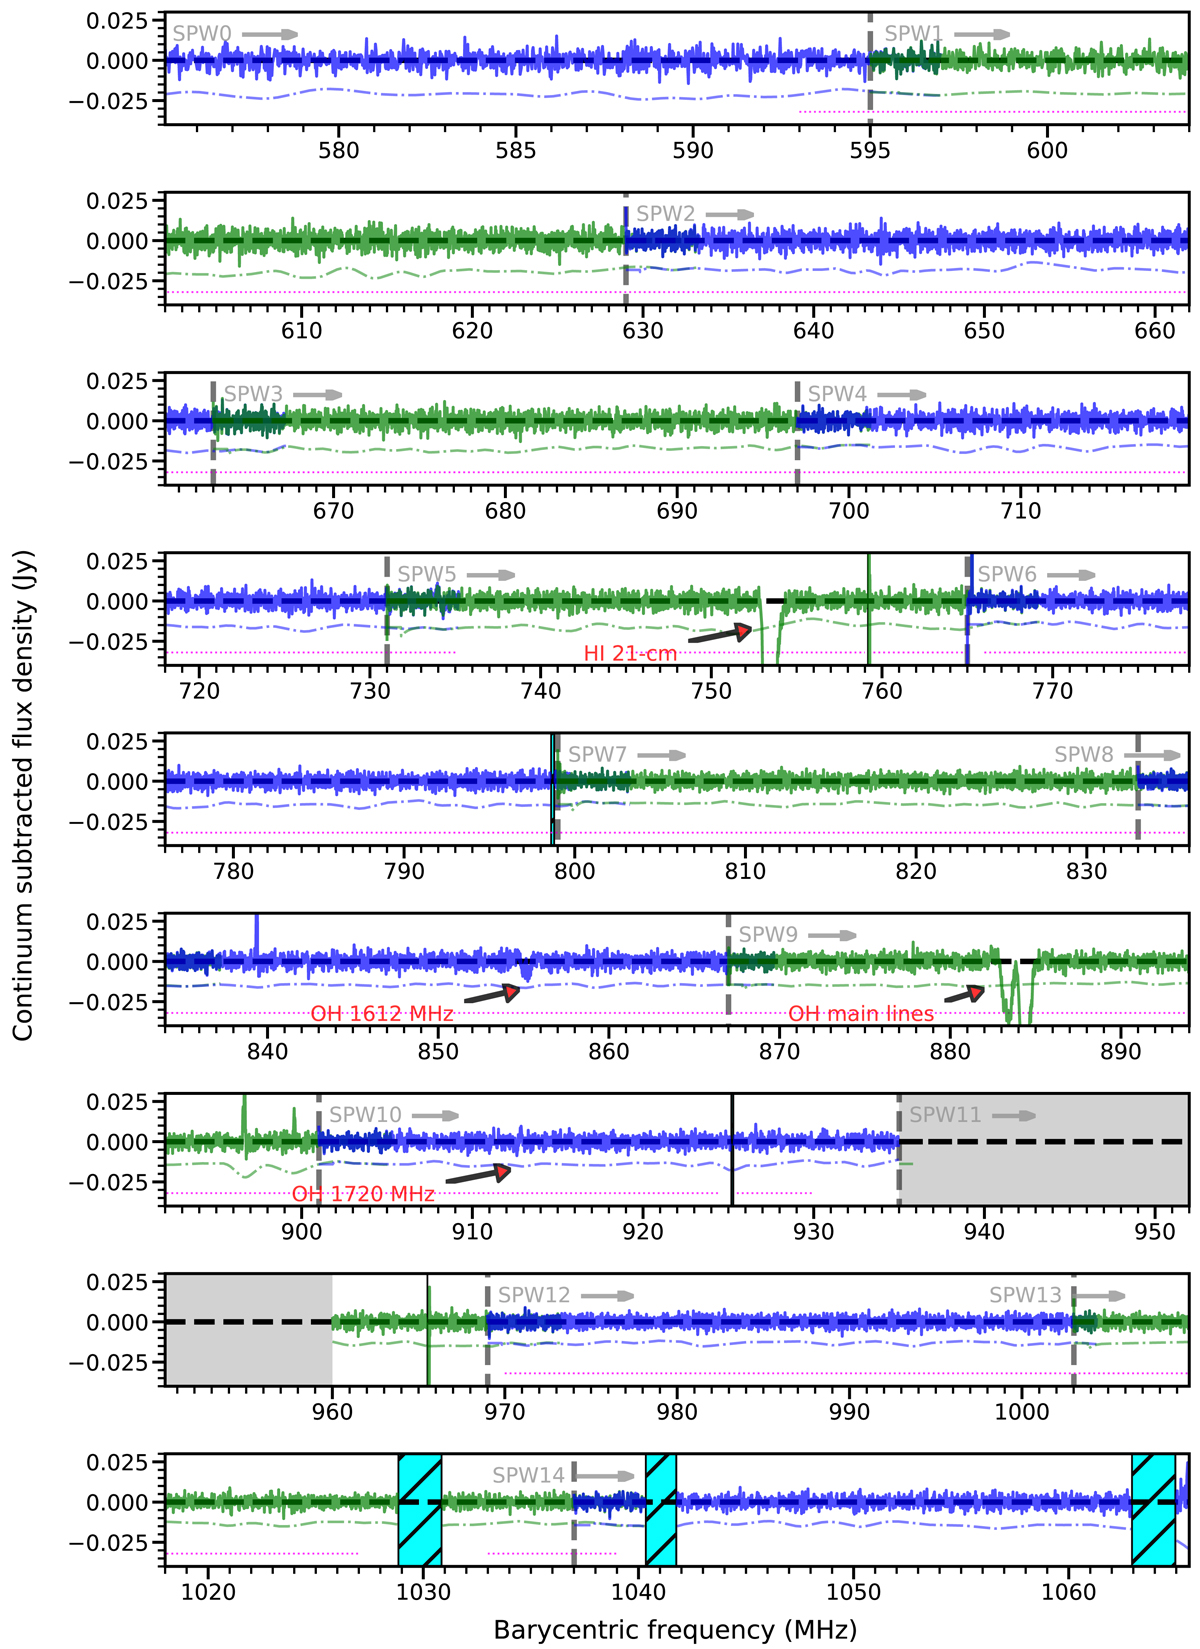
Continuum-subtracted Stokes-I spectrum of PKS 1830−211. The adjacent SPWs are plotted alternately in blue and green, separated by dashed vertical lines. Gray-shaded regions mark frequency ranges that were masked prior to any calibration. Hatched regions were masked after calibration and imaging to exclude persistent RFI identified during the absorption line analysis. The dash-dotted blue or green lines represent the error spectrum (5 × σrolling). The dotted magenta line marks frequency ranges used for the continuum imaging. The locations of redshifted H I 21 cm and OH 18 cm line frequencies at z = 0.89 are also indicated.
Current usage metrics show cumulative count of Article Views (full-text article views including HTML views, PDF and ePub downloads, according to the available data) and Abstracts Views on Vision4Press platform.
Data correspond to usage on the plateform after 2015. The current usage metrics is available 48-96 hours after online publication and is updated daily on week days.
Initial download of the metrics may take a while.