Fig. 4.
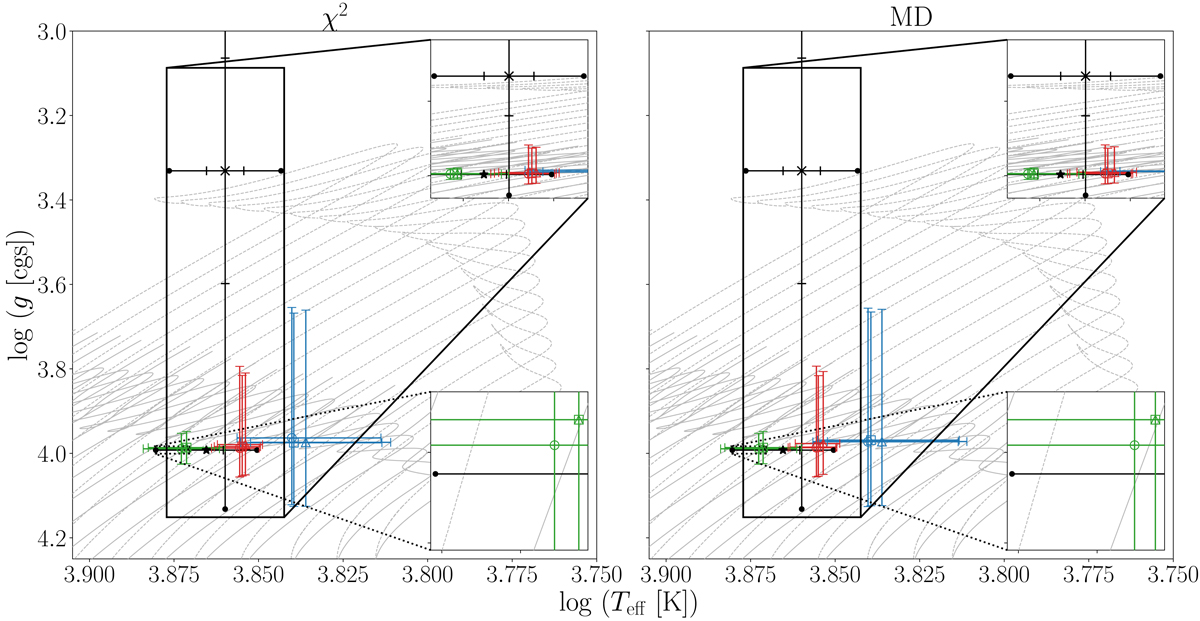
Positions of the best-fitting models from Π0-based asteroseismic modelling on Kiel diagrams. The main plots show the results of using the whole grid in the fit, while the inset plots show the results of applying the ‘pseudo-single-star’ spectroscopic Teff and log g (solid box) and dynamical M, Teff, and log g (dotted box) constraints. The observed positions of the star according to the spectroscopic and dynamical parameters are represented by black ‘X’ symbols and stars respectively. The 1σ and 3σ spectroscopic and dynamical error bars are represented with straight end-caps and ball end-caps respectively. The Yobs = (Π0, ℓ = 1), Yobs = (Π0, ℓ = 1), and Yobs = (Π0, ℓ = 1, Π0, ℓ = 2) solutions for the different grid subsets are represented by the same colours and symbols as in Fig. 3. Left panel: results of using a ![]() merit function and right panel: results of using an MD merit function. The error bars on the asteroseismic solutions are based on 68% HPD intervals of the Monte Carlo parameter distributions. The solid and dashed grey curves are the same as in Fig. 1.
merit function and right panel: results of using an MD merit function. The error bars on the asteroseismic solutions are based on 68% HPD intervals of the Monte Carlo parameter distributions. The solid and dashed grey curves are the same as in Fig. 1.
Current usage metrics show cumulative count of Article Views (full-text article views including HTML views, PDF and ePub downloads, according to the available data) and Abstracts Views on Vision4Press platform.
Data correspond to usage on the plateform after 2015. The current usage metrics is available 48-96 hours after online publication and is updated daily on week days.
Initial download of the metrics may take a while.