Fig. 3.
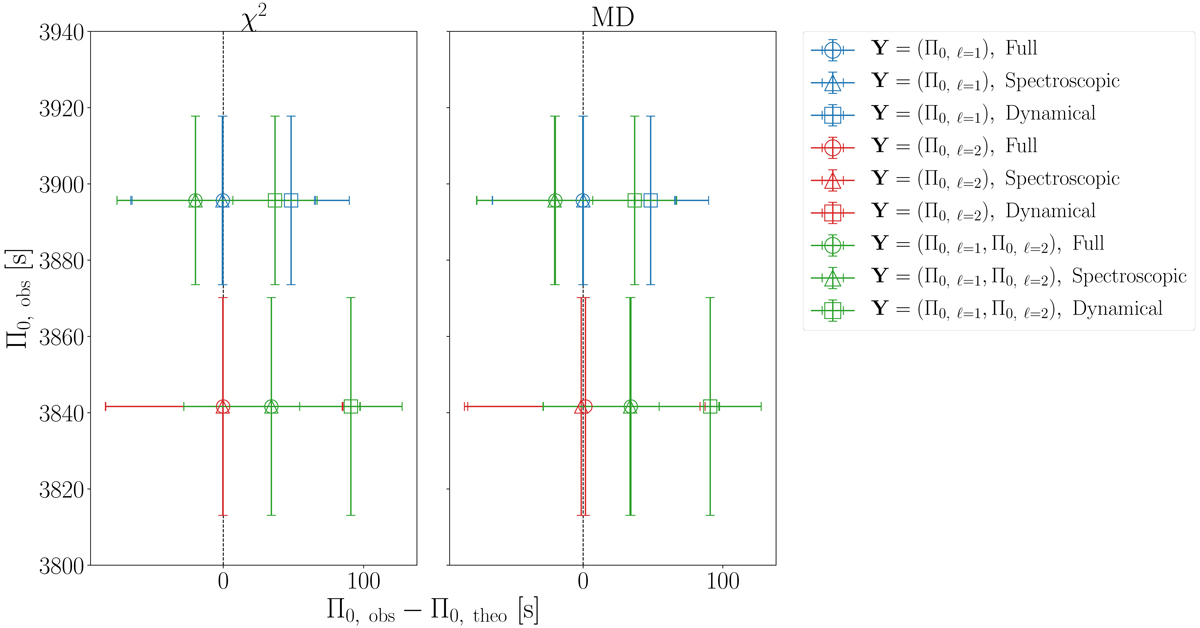
Best-fitting Π0 values of our Π0-based asteroseismic modelling, based on three different grid setups (full, spectroscopic, and dynamical). Left panel: results of using a ![]() merit function and right panel: results of using an MD merit function. The vertical dashed black line represents the zero-point of the difference between the observational and theoretical Π0 (i.e. Π0, obs − Π0, theo = 0). The error bars are based on 68% HPD intervals of the Monte-Carlo parameter distributions.
merit function and right panel: results of using an MD merit function. The vertical dashed black line represents the zero-point of the difference between the observational and theoretical Π0 (i.e. Π0, obs − Π0, theo = 0). The error bars are based on 68% HPD intervals of the Monte-Carlo parameter distributions.
Current usage metrics show cumulative count of Article Views (full-text article views including HTML views, PDF and ePub downloads, according to the available data) and Abstracts Views on Vision4Press platform.
Data correspond to usage on the plateform after 2015. The current usage metrics is available 48-96 hours after online publication and is updated daily on week days.
Initial download of the metrics may take a while.