Free Access
Fig. 2.
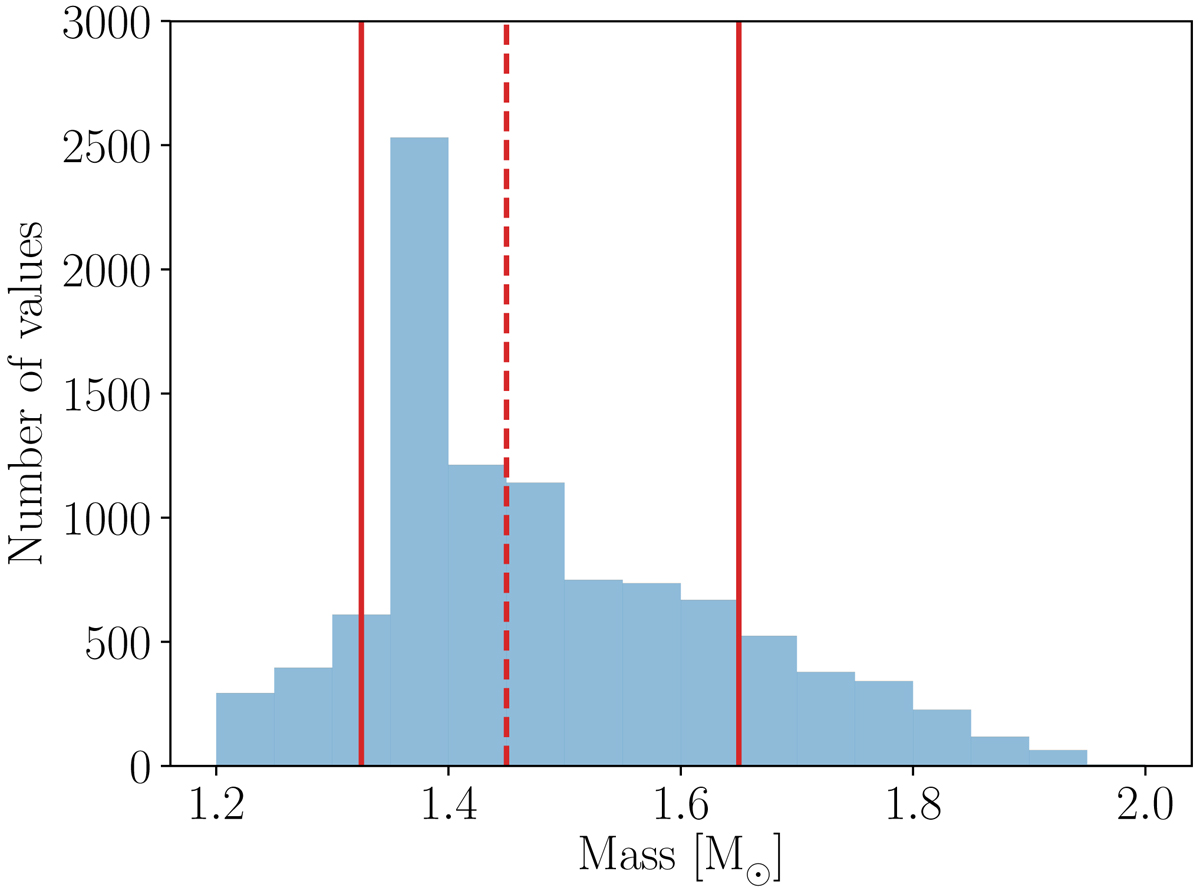
Example of the distribution of M values in the posterior distribution of models selected through our Monte-Carlo fitting framework. The vertical dashed line represents the median value and the vertical solid lines represent the upper and lower bounds of 68% HPD of the M values.
Current usage metrics show cumulative count of Article Views (full-text article views including HTML views, PDF and ePub downloads, according to the available data) and Abstracts Views on Vision4Press platform.
Data correspond to usage on the plateform after 2015. The current usage metrics is available 48-96 hours after online publication and is updated daily on week days.
Initial download of the metrics may take a while.