Fig. D.1.
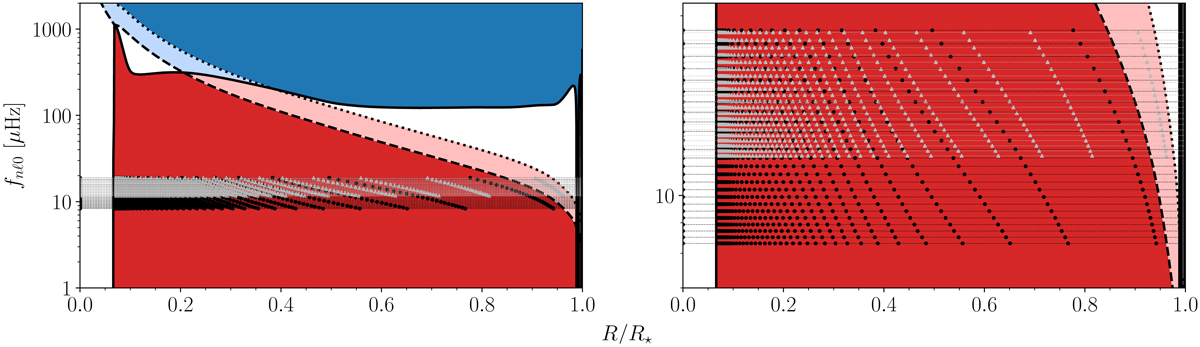
Propagation diagrams showing the mode cavities, frequencies and nodes of the theoretical period-spacing pattern of our overall best model (M = 1.65 M⊙, Xc = 0.24, fov = 0.005, and log Dmix = 1.5). The thick solid, dashed and dotted curves represent the Brunt–Väisälä frequency (N), and the ℓ = 1 and ℓ = 2 Lamb frequencies (Sℓ = 1 and Sℓ = 2) respectively. The red region represents the ℓ = 1 g mode cavity that gets extended by the pink region for the ℓ = 2 g-modes. The blue region represents the ℓ = 2 p-mode cavity that gets extended by the light blue region for the ℓ = 1 p modes. The horizontal black and grey dotted lines represent the 20 ℓ = 1 and 11 ℓ = 2 theoretical frequencies, with the nodes of radial Lagrangian displacement vector for each frequency represented by black circles and grey triangles respectively. Right panel: magnification of the frequency region in which the theoretical modes propagate.
Current usage metrics show cumulative count of Article Views (full-text article views including HTML views, PDF and ePub downloads, according to the available data) and Abstracts Views on Vision4Press platform.
Data correspond to usage on the plateform after 2015. The current usage metrics is available 48-96 hours after online publication and is updated daily on week days.
Initial download of the metrics may take a while.