Fig. 1.
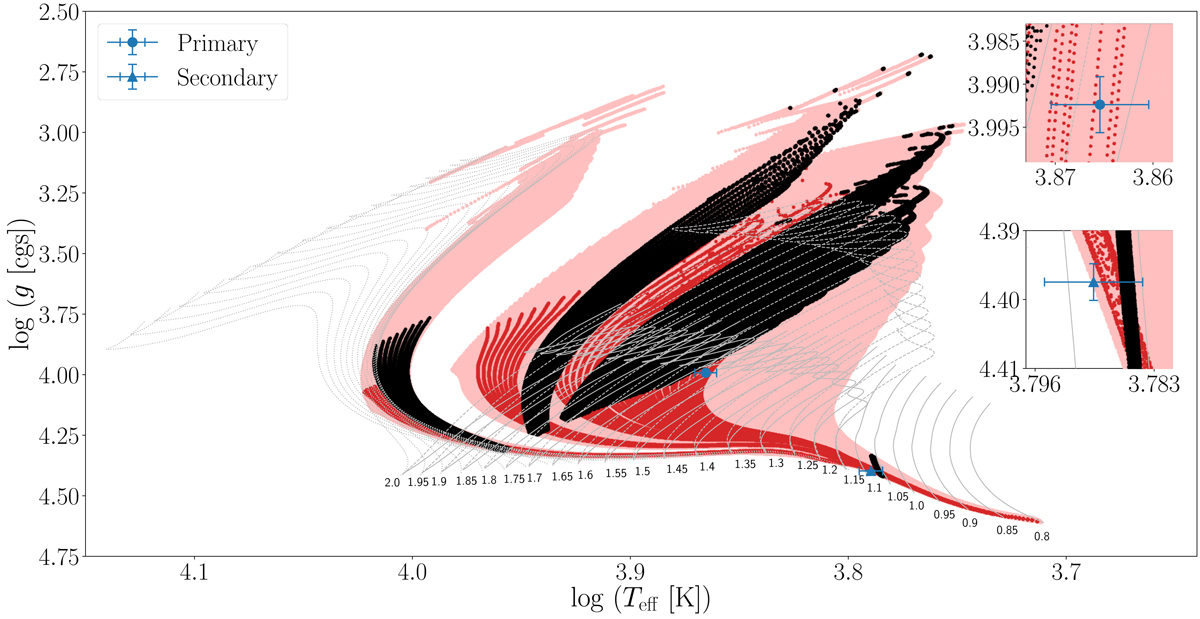
Isocloud fit to the components of KIC 9850387 on the log Teff − log g diagram. The red regions correspond to the best-fitting isocloud, and the pink regions represent the isoclouds in the 95% HPD interval of the fit. The black regions on the isocloud represent the log Teff − log g values corresponding to the dynamical masses of the individual components. The grey curves are MESA evolutionary tracks with fov = 0.005 and log Dmix = 0.0 (solid), fov = 0.04 and log Dmix = 0.0 (dashed), and fov = 0.04 and log Dmix = 4.0 (dotted) with their corresponding masses (in units of M⊙) indicated at the ZAMS of each track. The inset plots are magnified regions around the position of the primary (top) and secondary (bottom) component.
Current usage metrics show cumulative count of Article Views (full-text article views including HTML views, PDF and ePub downloads, according to the available data) and Abstracts Views on Vision4Press platform.
Data correspond to usage on the plateform after 2015. The current usage metrics is available 48-96 hours after online publication and is updated daily on week days.
Initial download of the metrics may take a while.