Free Access
Fig. 9
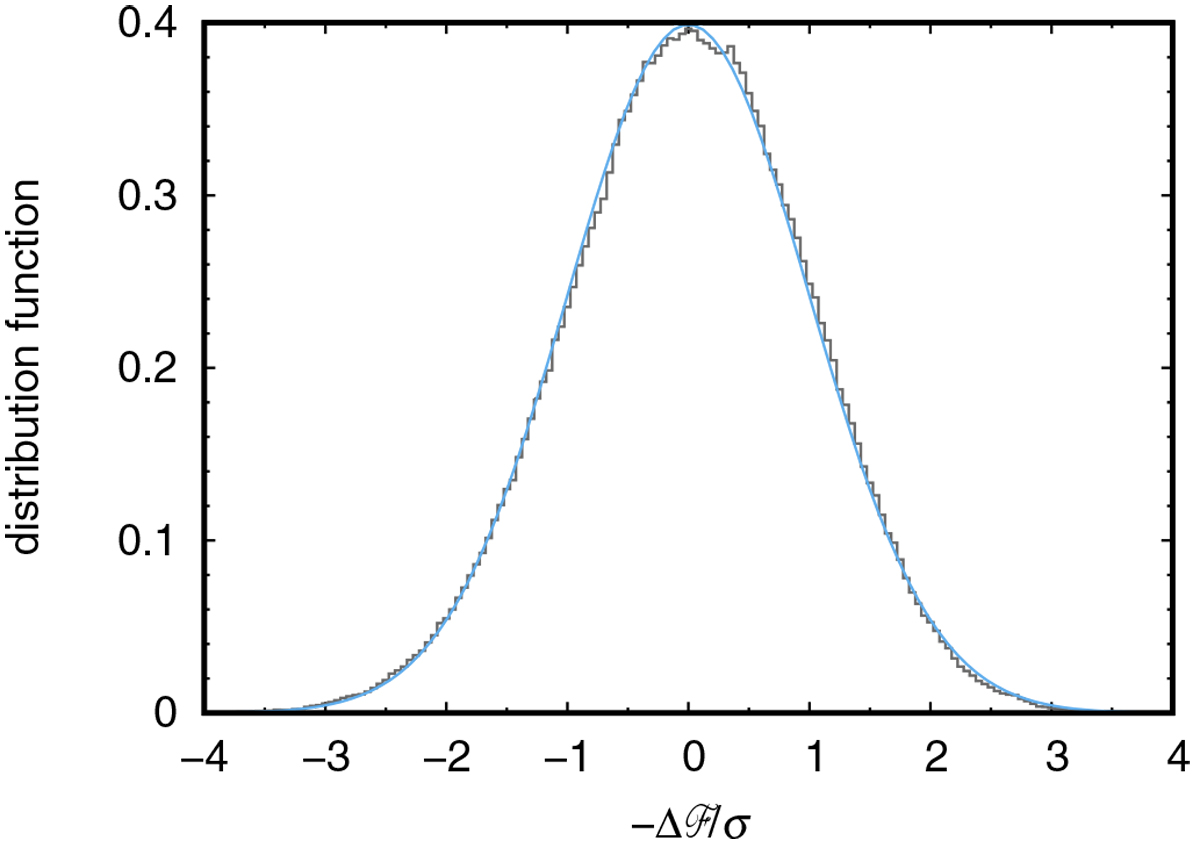
Distribution of flux variations of TESS observations ![]() relative to the dispersion σ
of individual light curves. The distribution function is normalised to unity. The abscissa gives
relative to the dispersion σ
of individual light curves. The distribution function is normalised to unity. The abscissa gives
![]() , which is directly proportional to the magnitude difference. The blue line denotes a Gaussian distribution.
, which is directly proportional to the magnitude difference. The blue line denotes a Gaussian distribution.
Current usage metrics show cumulative count of Article Views (full-text article views including HTML views, PDF and ePub downloads, according to the available data) and Abstracts Views on Vision4Press platform.
Data correspond to usage on the plateform after 2015. The current usage metrics is available 48-96 hours after online publication and is updated daily on week days.
Initial download of the metrics may take a while.