Fig. 9.
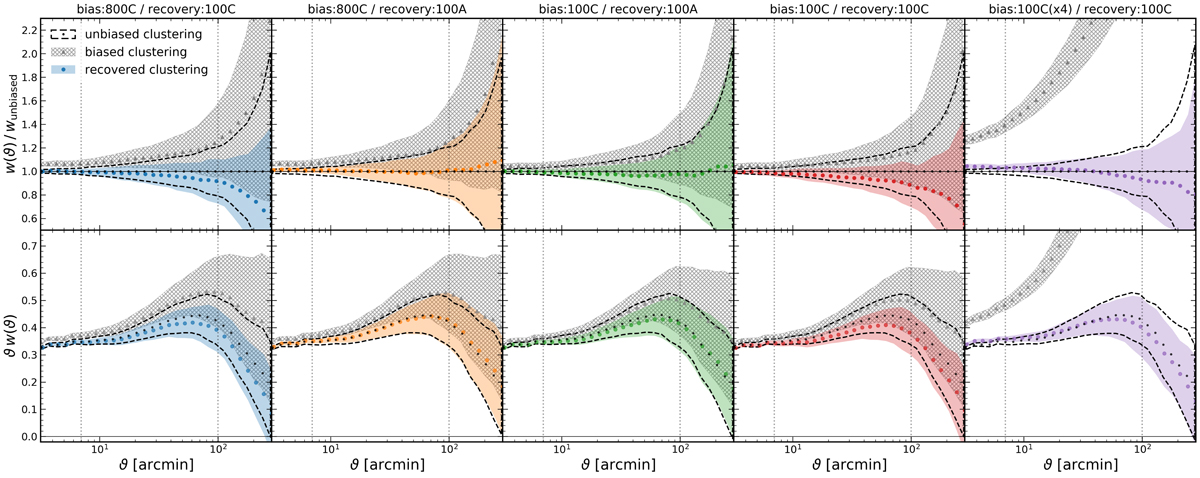
Angular clustering correlation functions w(ϑ) measured in FLASK fields after they have been depleted (as described in Sect. 5.2; Eq. (5.3)) according to the output of various SOMs trained against the KiDS-1000 bright sample (KiDS-Bright). For each configuration, panel titles give the bias:SOM trained against KiDS-Bright, and the recovery:SOM trained against biased FLASK data to create organised randoms. Top: ratios of measured clustering signals to the true, unbiased clustering. Bottom: unbiased angular clustering signature (black points and dashed curves; measured with uniform randoms on unbiased FLASK fields), compared with biased (grey triangles and hatching; measured with uniform randoms) and recovered (coloured points and shading; measured with organised randoms) clustering signals measured in the depleted fields. Errors are the root-diagonal of the covariance over 30 FLASK realisations, and all are given to ±1σ. From left to right, the FLASK fields are biased according to δOR from the 800C, 800C, 100C, 100C, and 100C SOMs, trained against KiDS-Bright. The m-parameter (Eq. (5.3)) is set to unity in all but the purple panel (where m = 4). Each correlation measured in the depleted fields using organised randoms displays improved consistency with the unbiased signal, compared to the signals measured using uniform randoms.
Current usage metrics show cumulative count of Article Views (full-text article views including HTML views, PDF and ePub downloads, according to the available data) and Abstracts Views on Vision4Press platform.
Data correspond to usage on the plateform after 2015. The current usage metrics is available 48-96 hours after online publication and is updated daily on week days.
Initial download of the metrics may take a while.