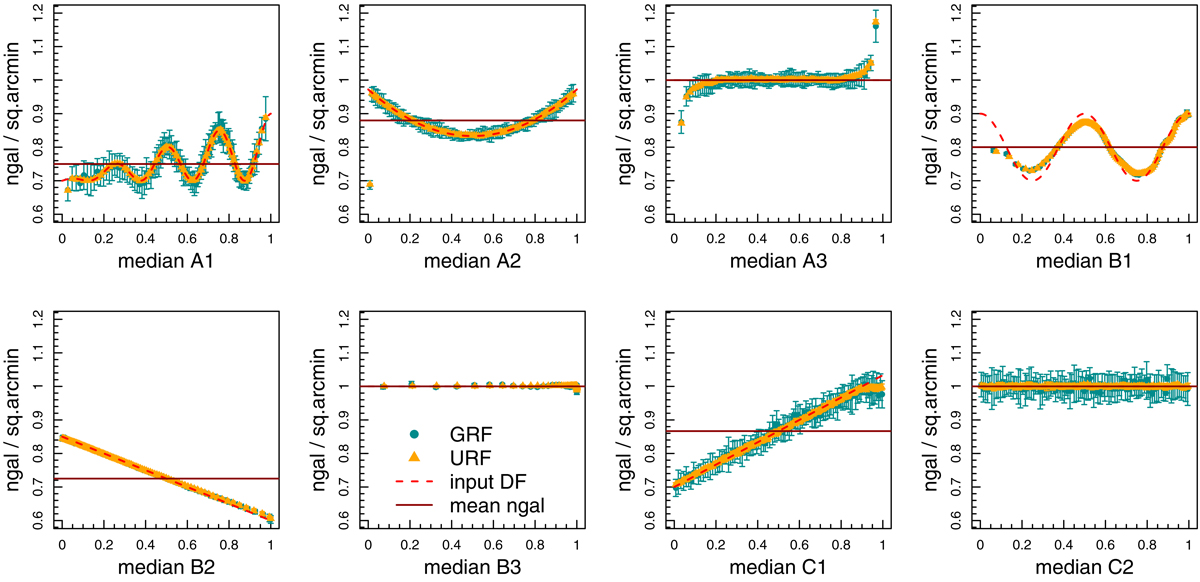
Fig. 7.

Recovery by the T1mock SOM (Table 2) of the artificial biases applied to 30 FLASK realisations (see Figs. 5 and 6) of random fields. Panels show the galaxy number density (arcmin−2) of 100 hierarchical clusters, defined on the SOM, against the median systematic value in each of these clusters. Green points give the results for SOMs trained against depleted lognormal random fields (GRF), and orange points give the same for uniform random fields (URF), each generated using FLASK. The functions describing systematic galaxy depletion relative to our artificial systematic parameters (from Fig. 6) are converted into expected number densities and shown here as dashed red lines (‘input DF’; depletion function). The solid horizontal lines indicate the global average number densities expected per systematic after depletion. Points where both our URF and GRF data sit systematically away from the expected values are artefacts due to footprint edge-effects in our FLASK simulations. They do not affect the conclusions of this test (see Sect. 4.2).
Current usage metrics show cumulative count of Article Views (full-text article views including HTML views, PDF and ePub downloads, according to the available data) and Abstracts Views on Vision4Press platform.
Data correspond to usage on the plateform after 2015. The current usage metrics is available 48-96 hours after online publication and is updated daily on week days.
Initial download of the metrics may take a while.


