Fig. 4.
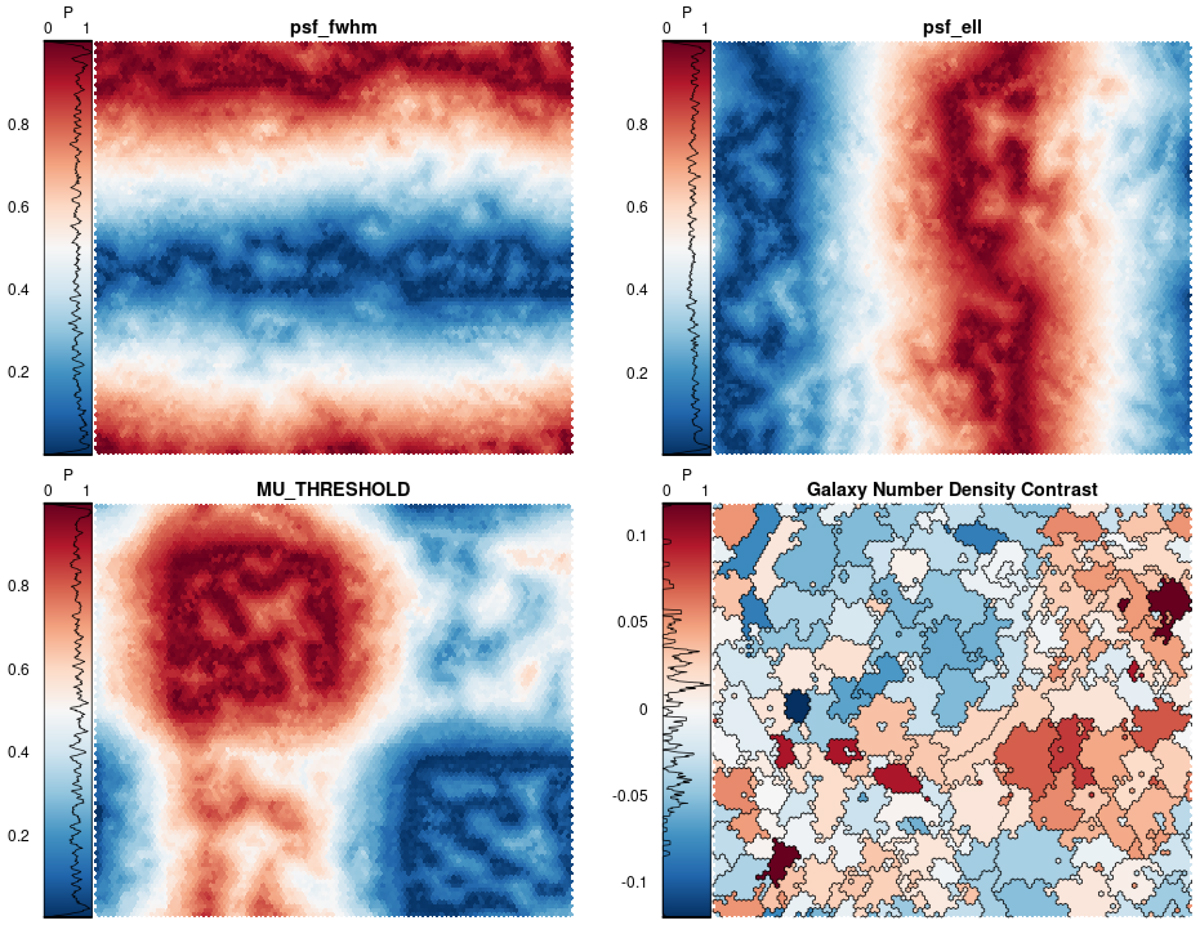
Self-organising maps, with dimension 100 × 100, coloured (top left, top right, bottom left) by the systematics values taken on by each cell during the training procedure described in Sect. 3. In the density contrast panel (bottom right), colours and black borders mark the 100 hierarchical clusters (see Sect. 3) defined according to groupings of cells with similar systematics-vectors for KiDS parameters psf_fwhm,psf_ell,MU_THRESHOLD (Table 1). Systematic-tracer variables are linearly mapped onto the interval [0, 1] before being passed to the SOM, hence the colour-bar ranges. The density contrast panel (bottom right) maps clusters of SOM pixels from their vectors of systematic-tracer values back onto a relative number density on-sky and reveals almost all systematic density fluctuations to be at ≲10%, as reckoned by this SOM configuration (100A; Table 2).
Current usage metrics show cumulative count of Article Views (full-text article views including HTML views, PDF and ePub downloads, according to the available data) and Abstracts Views on Vision4Press platform.
Data correspond to usage on the plateform after 2015. The current usage metrics is available 48-96 hours after online publication and is updated daily on week days.
Initial download of the metrics may take a while.