Fig. 3.
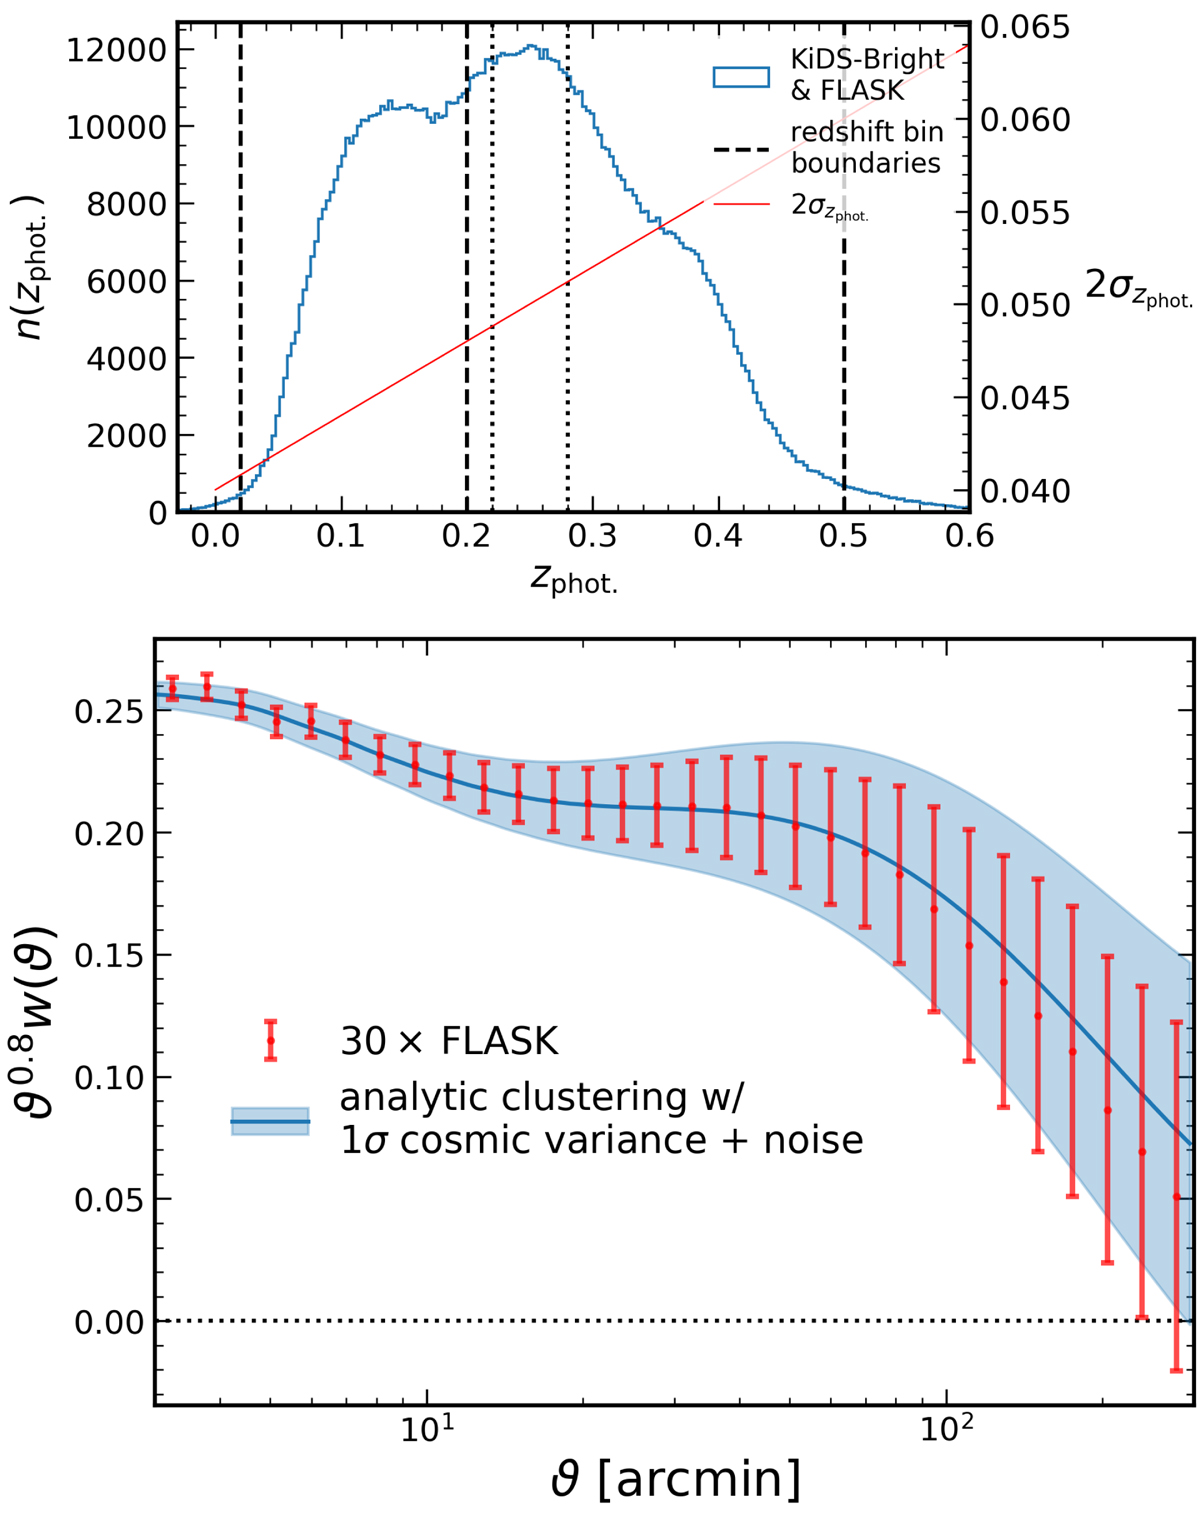
Top: photometric redshift distribution of the KiDS-Bright GAMA-like KiDS DR4 bright sample (Bilicki et al. 2021), with the zphot. = {0.02, 0.2, 0.5} redshift bins (dashed lines) employed in our clustering analysis (Sect. 6) and the additional bins zphot.,1a = {0.02, 0.22} and zphot.,2a = {0.28, 0.5} (dotted lines) defined to have minimal photo-z overlap, as reckoned by the 95% scatter (red line); 2σzphot. ∼ 0.05, at that redshift. We use this n(zphot.) distribution to generate angular power spectra and FLASK mock galaxy catalogues. Bottom: full redshift-range angular clustering (red) averaged over 30 independent FLASK lognormal random field realisations of the input power spectrum, which is displayed in blue (see Eq. (5.2)) with the theoretical 1σ error for a KiDS-Bright-like survey, with 0.36 galaxies per square arcminute over 900 deg2. The galaxy bias is set to unity. Error bars are the root-diagonal of the covariance across the 30 realisations. We note that for the 30 data points shown, the covariance over just 30 realisations of the field is quite noisy. We are clearly able to recover the analytical input cosmology with these 30 realisations from FLASK.
Current usage metrics show cumulative count of Article Views (full-text article views including HTML views, PDF and ePub downloads, according to the available data) and Abstracts Views on Vision4Press platform.
Data correspond to usage on the plateform after 2015. The current usage metrics is available 48-96 hours after online publication and is updated daily on week days.
Initial download of the metrics may take a while.