Fig. D.1.
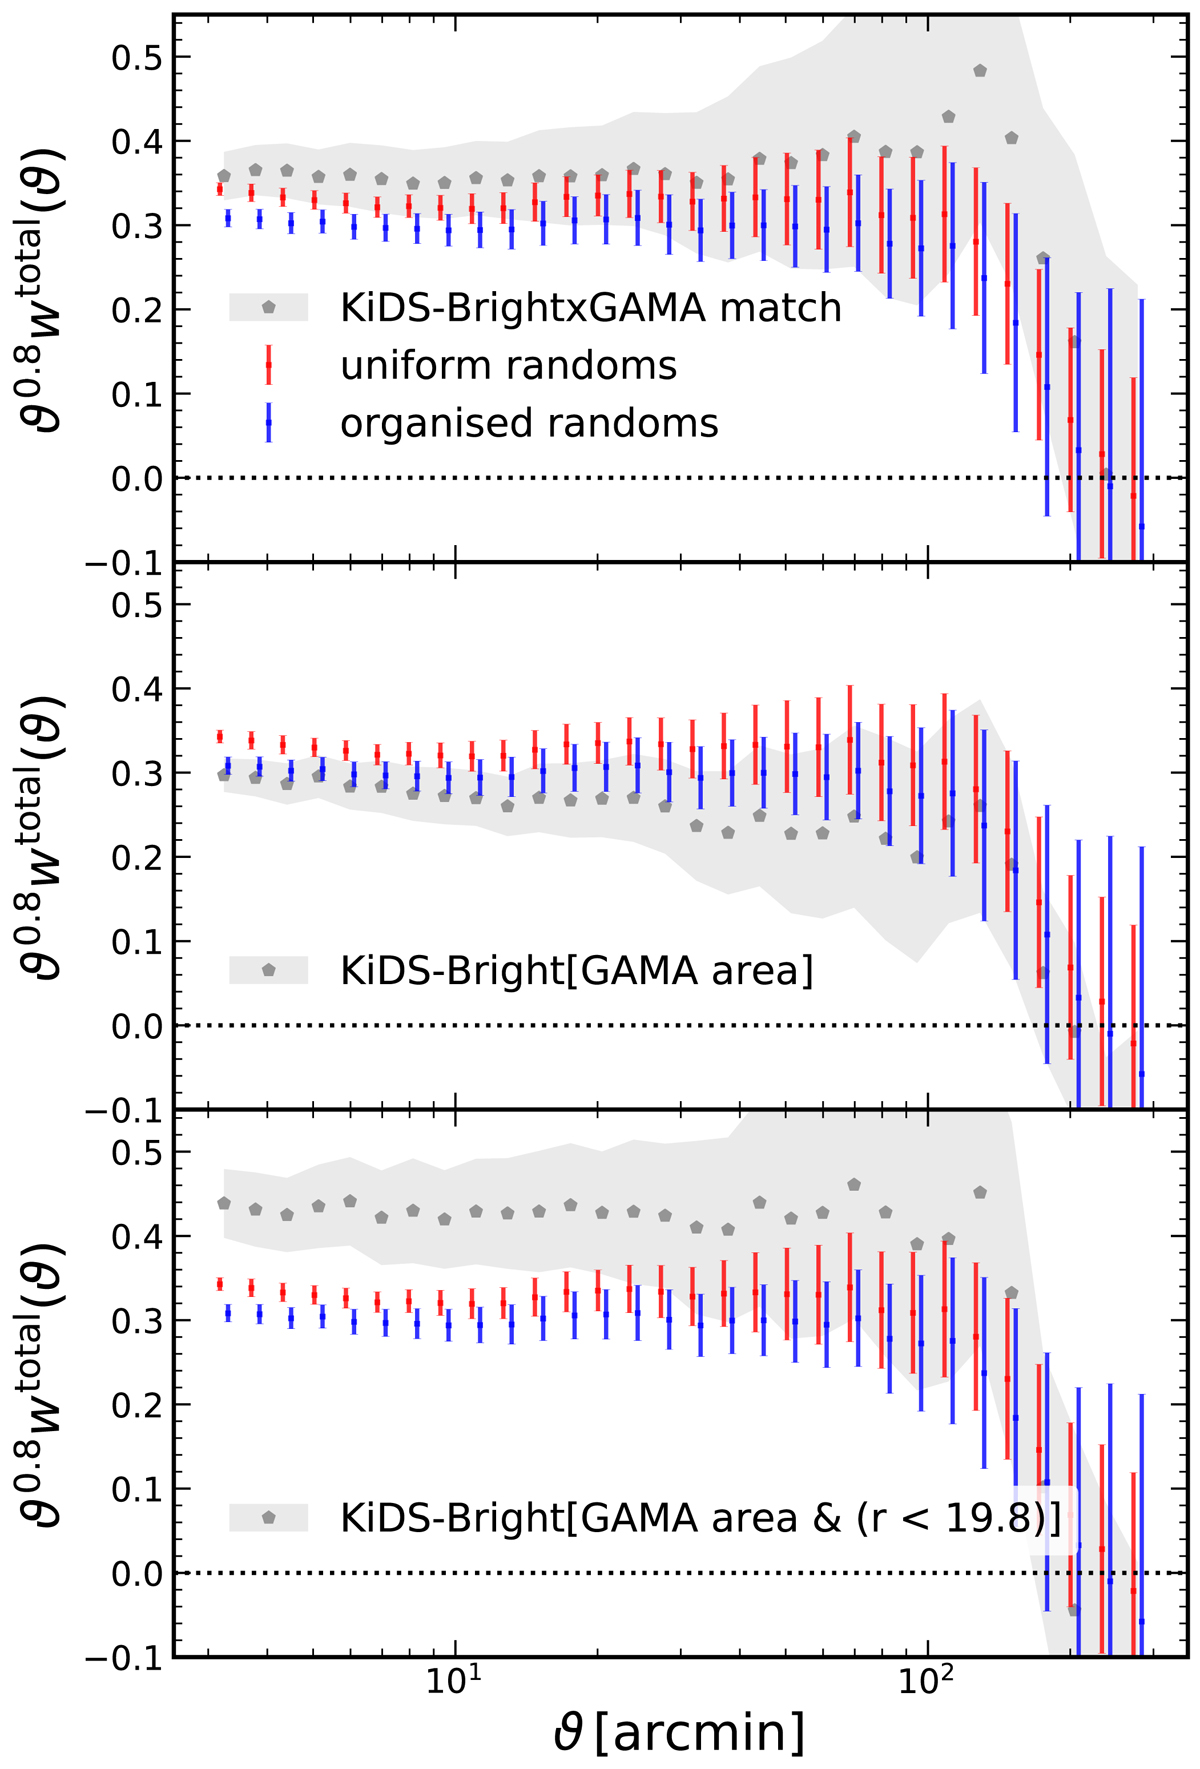
Comparison of different clustering measurements in the GAMA area and how they compare with the KiDS-Bright correlations measured with (blue) and without (red) 100A organised randoms. Red and blue data-points are the same in all rows, whilst grey points and shading are the angular clustering measured with uniform randoms for (top) the KiDS-Bright-GAMA cross-matched catalogue, (middle) KiDS-Bright galaxies within the GAMA window, and (bottom) KiDS-Bright galaxies within the GAMA window, and with r < 19.8. Errors are estimated with delete-one jackknifes from 31 sub-regions of KiDS-Bright or 20 sub-regions of the GAMA window. Errors on scales ϑ ≳ 180 arcmin (the approximate scale of each sub-region) are thus likely to be underestimated for the GAMA-area correlations.
Current usage metrics show cumulative count of Article Views (full-text article views including HTML views, PDF and ePub downloads, according to the available data) and Abstracts Views on Vision4Press platform.
Data correspond to usage on the plateform after 2015. The current usage metrics is available 48-96 hours after online publication and is updated daily on week days.
Initial download of the metrics may take a while.