Fig. B.3.
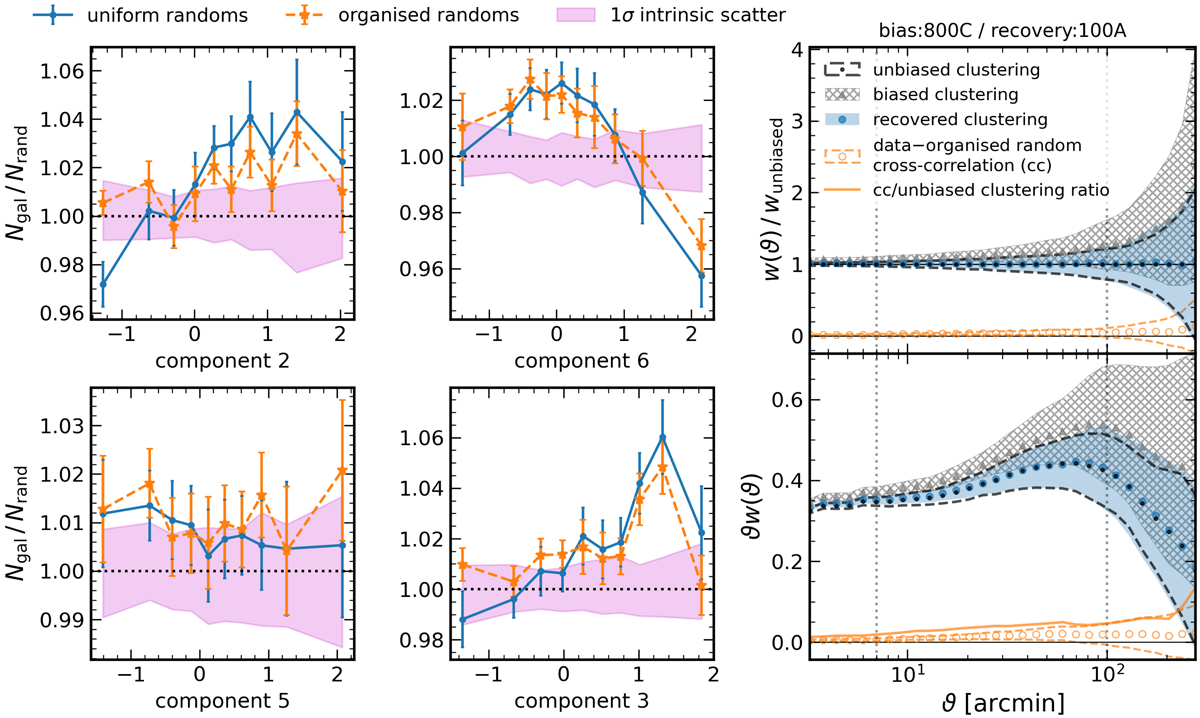
Illustration of divergent one- and two-point correlation corrections from organised randoms. Left: pixel (one-point) correlations between the galaxy number density Ngal/Nrand in biased (according to the 800C SOM) FLASK mocks and the mean PCA components in the same pixels (see Appendix B). Correlations normalised by uniform randoms’ counts-in-pixels are given in blue, and those normalised (corrected) by the pixel counts of 100A organised randoms are given in orange. Correlations and errors are the mean and the root-diagonal of the covariance over 30 FLASK realisations, respectively. Purple shading indicates the expected intrinsic 1σ spread in these correlations, as calculated over 100 unbiased FLASK realisations (Fig. B.1). Shown here are the 4 (out of 14) correlations for which the organised randoms correction most improves consistency with unity. Right: corresponding biased and recovered two-point angular clustering correlations w(ϑ), shown in ratio to (top) and overlaid on (bottom) the unbiased clustering signature, as in Fig. 9. We also show the cross-correlation between organised randoms and the unbiased data and its ratio to the unbiased clustering signal in orange. Correlations and errors are again the mean and the root-diagonal of the covariance over 30 FLASK realisations.
Current usage metrics show cumulative count of Article Views (full-text article views including HTML views, PDF and ePub downloads, according to the available data) and Abstracts Views on Vision4Press platform.
Data correspond to usage on the plateform after 2015. The current usage metrics is available 48-96 hours after online publication and is updated daily on week days.
Initial download of the metrics may take a while.