Fig. B.1.
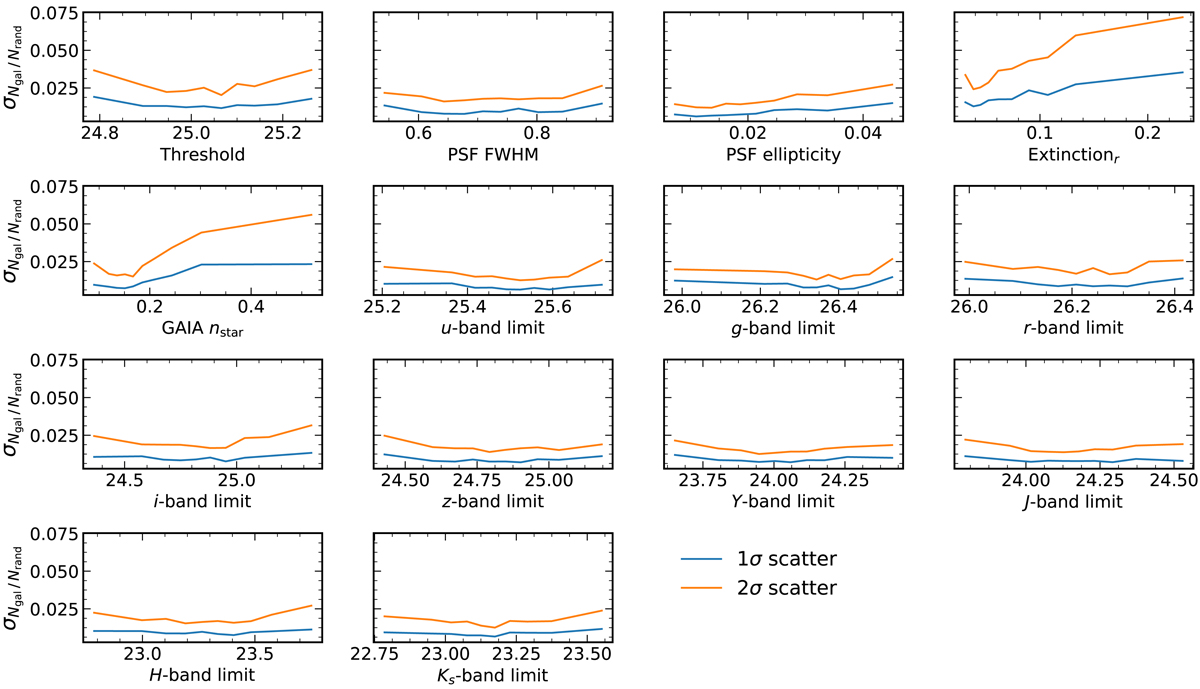
Intrinsic scatter of Ngal/Nrand vs. various systematics tracer variables (Table 1) as measured over 100 FLASK realisations with the KiDS-Bright survey parameters and footprint. Without any biases applied to the FLASK realisations, the blue (1σ) curves give half the difference between the 16th and 84th percentiles of the distribution of 100 individual Ngal/Nrand vs. systematics correlations. 2σ (orange) curves give half the difference between the 2.5th and 97.5th percentiles. Galaxy/random counts and mean systematics are taken in nside = 256 pixels, about 14 arcmin in size.
Current usage metrics show cumulative count of Article Views (full-text article views including HTML views, PDF and ePub downloads, according to the available data) and Abstracts Views on Vision4Press platform.
Data correspond to usage on the plateform after 2015. The current usage metrics is available 48-96 hours after online publication and is updated daily on week days.
Initial download of the metrics may take a while.