Fig. A.2.
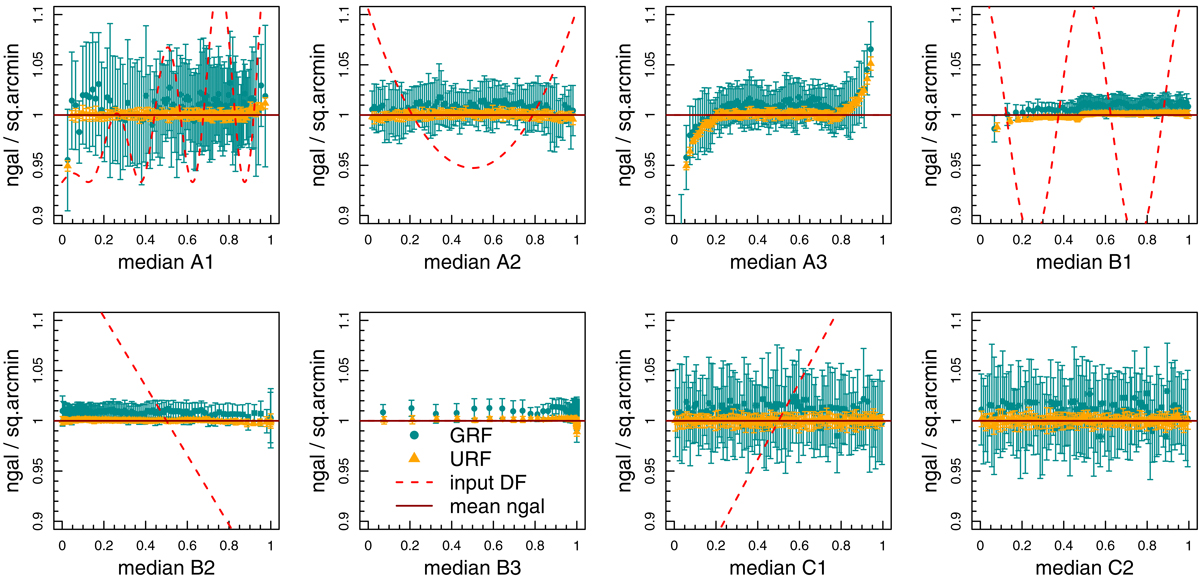
Same as Fig. 7, but for a SOM trained on an unbiased FLASK field. The depletion functions are again shown as dashed red lines, although no depletions were applied. Irregularities in the A3 panel, for example, are discussed in Sect. 4.2. Data-points derived from lognormal random fields (green) are on average higher in ngal than those from uniform fields (orange) because of the clustering of galaxies. The Cartesian grid we used to estimate the area of the sample has more empty cells for the GRF, hence the area is under-estimated and ngal is over-reported.
Current usage metrics show cumulative count of Article Views (full-text article views including HTML views, PDF and ePub downloads, according to the available data) and Abstracts Views on Vision4Press platform.
Data correspond to usage on the plateform after 2015. The current usage metrics is available 48-96 hours after online publication and is updated daily on week days.
Initial download of the metrics may take a while.