Fig. 10.
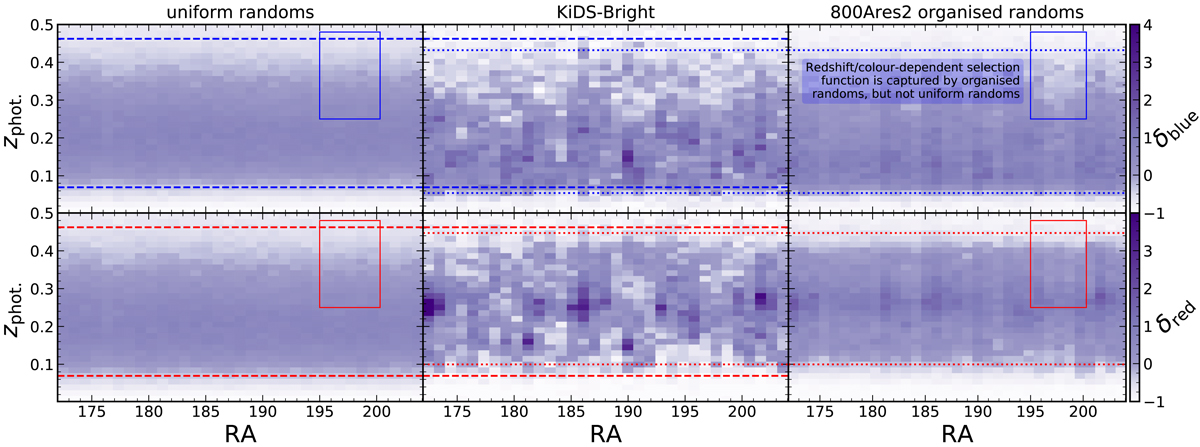
Galaxy number density contrast δ in 2D bins of photometric redshift vs. RA for uniform randoms (left), the KiDS-1000 bright sample (KiDS-Bright; middle), and relevant clones from 800Ares2 organised randoms (right). Rows display blue (top) and red (bottom) galaxies, according to a boundary at observer-frame u − i = 2.66. We only show galaxies in the range 172 < RA < 205, 2 < Dec < 3 in order to reveal systematic density variations in the data and randoms. Unlike for uniform randoms, the organised randoms can be seen to reproduce the systematic trends in the KiDS-Bright data, namely under-densities over different pointings (e.g., RA = 175.5, 197.5), visible as vertical bands of fainter pixels, and the differential evolution of densities in the samples with redshift, as evidenced by the boxes (highlighting a specific volume with differential density as a function of sample colour) and horizontal lines (dashed lines give the zphot. corresponding to the 3rd and 97th percentile number counts for uniform randoms, and dotted lines give these for KiDS-Bright data). We elect to display 800Ares2 randoms here for a clearer illustration of the cloning mechanism, which is more subtle in our other favoured randoms (see Sect. 5.3).
Current usage metrics show cumulative count of Article Views (full-text article views including HTML views, PDF and ePub downloads, according to the available data) and Abstracts Views on Vision4Press platform.
Data correspond to usage on the plateform after 2015. The current usage metrics is available 48-96 hours after online publication and is updated daily on week days.
Initial download of the metrics may take a while.