Fig. 1.
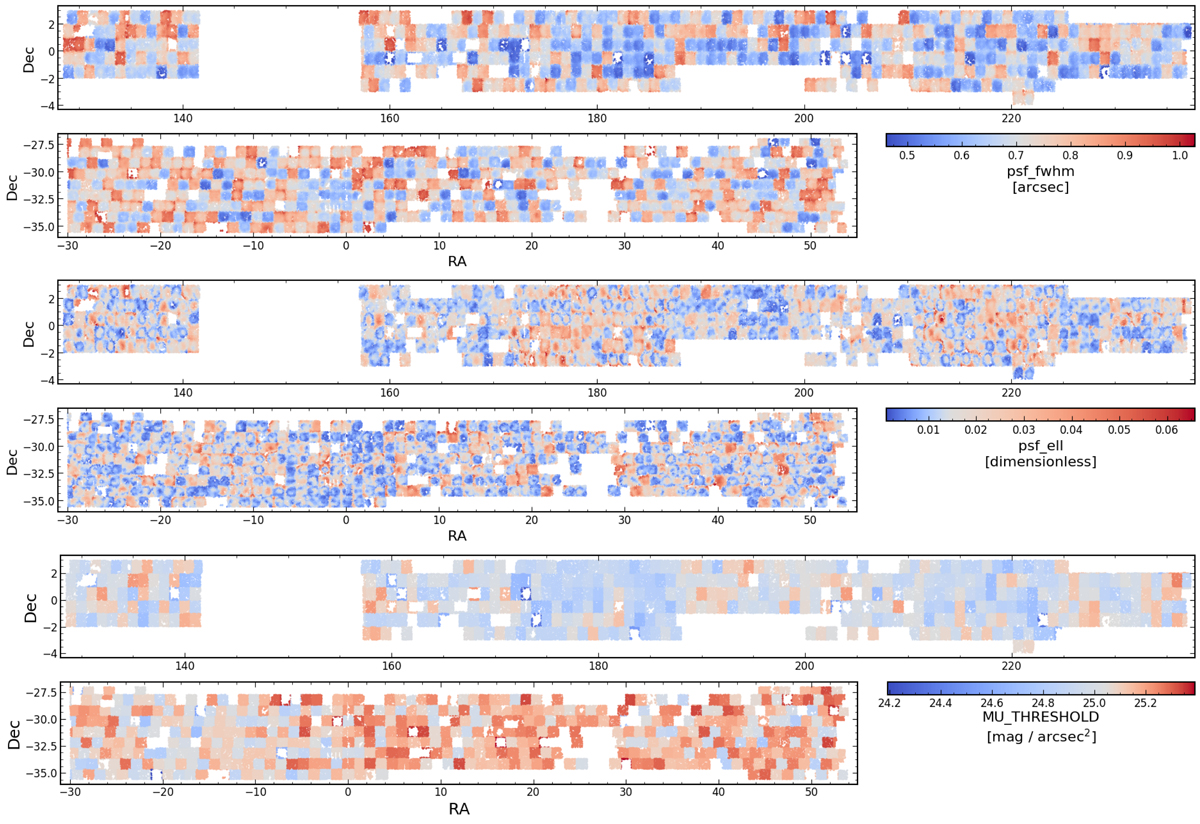
Maps of systematic-tracer variables (from Table 1) from r-band (the detection band) imaging in the KiDS-North (top panels) and KiDS-South (bottom panels) areas. Grey denotes the 50th percentile of the systematics distribution in each case, and blue and red then denote good and bad observing conditions relative to the 50th percentile. As we show in Fig. 4, the majority of spatial variations in galaxy number density correlate with these parameters at ≲5%.
Current usage metrics show cumulative count of Article Views (full-text article views including HTML views, PDF and ePub downloads, according to the available data) and Abstracts Views on Vision4Press platform.
Data correspond to usage on the plateform after 2015. The current usage metrics is available 48-96 hours after online publication and is updated daily on week days.
Initial download of the metrics may take a while.