Fig. 8
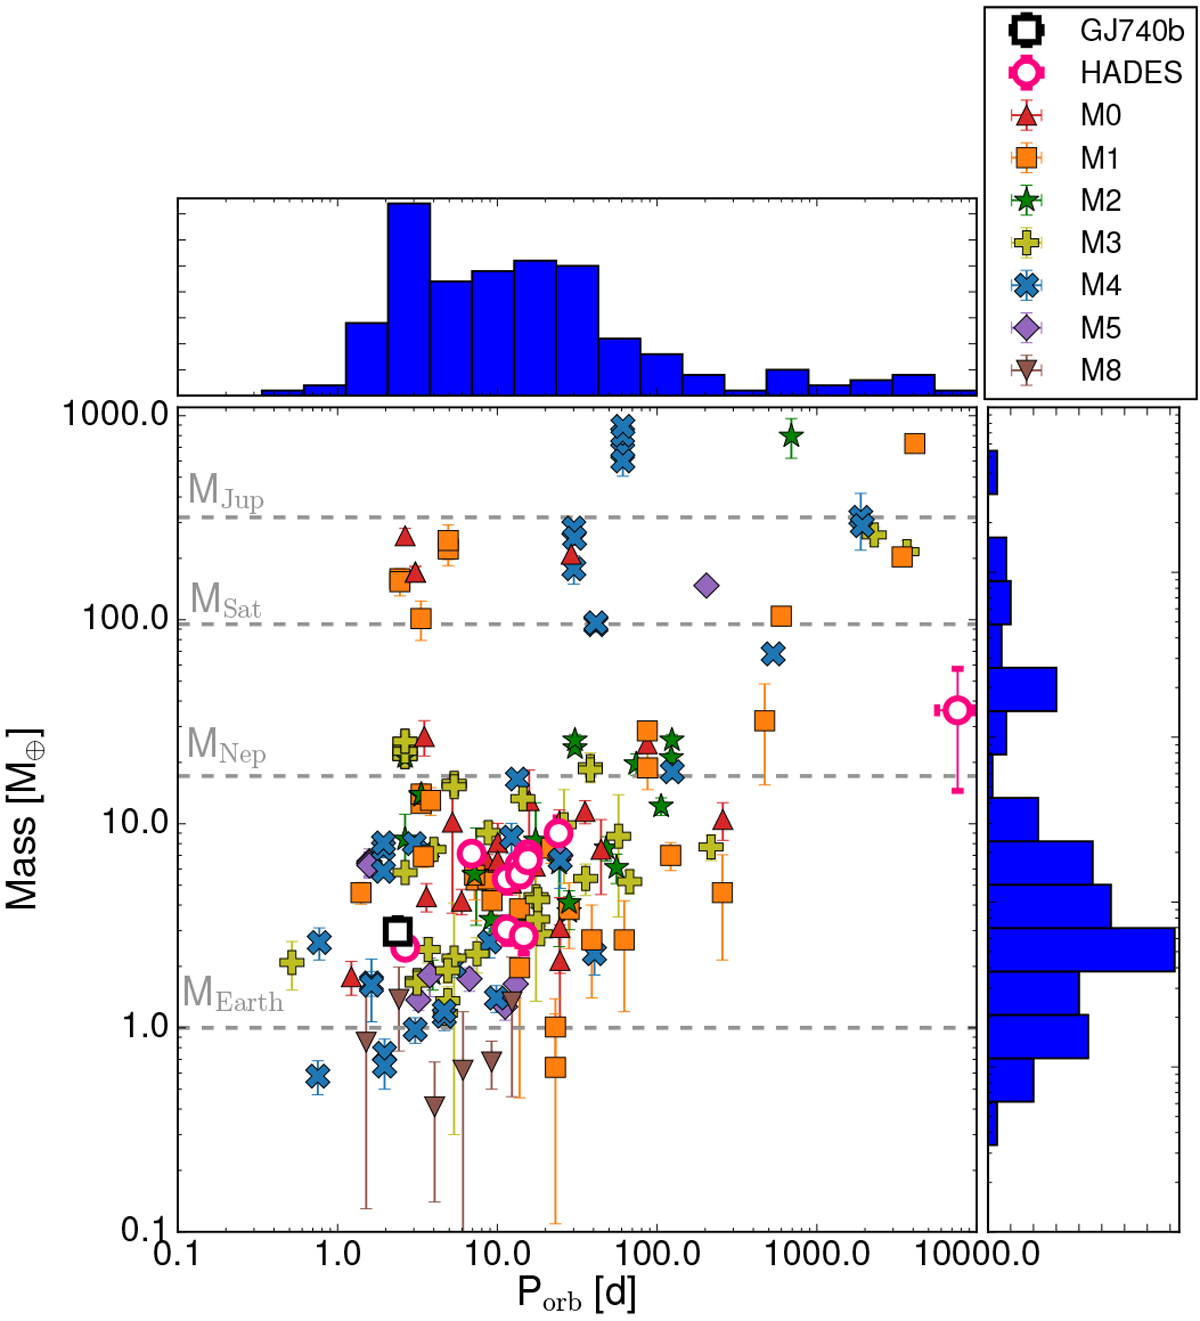
Mass-period diagram including the detected exoplanets from NASA exoplanets archive with published masses and orbital periods orbiting around M-type stars. The sub-spectral type of the parent star is indicated with a unique symbol and color. GJ 740 b has been represented with an unfilled black square, and the HADES detections (GJ 3998 b and GJ 3998 c, Affer et al. 2016; GJ 625 b, Suárez Mascareño et al. 2017: GJ 3942 b, Perger et al. 2017a; Gl 15 A b and Gl 15 A c, Pinamonti et al. 2018; Gl 686 b, Affer et al. 2019; Gl 49 b, Perger et al. 2019; and GJ 685 b, Pinamonti et al. 2019) have been marked with pink unfilled dots. The four horizontal dashed lines indicate the mass of Jupiter, Saturn, Neptune, and the Earth as a reference. The top and right panels contain the mass and orbital period distribution of the sample.
Current usage metrics show cumulative count of Article Views (full-text article views including HTML views, PDF and ePub downloads, according to the available data) and Abstracts Views on Vision4Press platform.
Data correspond to usage on the plateform after 2015. The current usage metrics is available 48-96 hours after online publication and is updated daily on week days.
Initial download of the metrics may take a while.