Free Access
Fig. 7
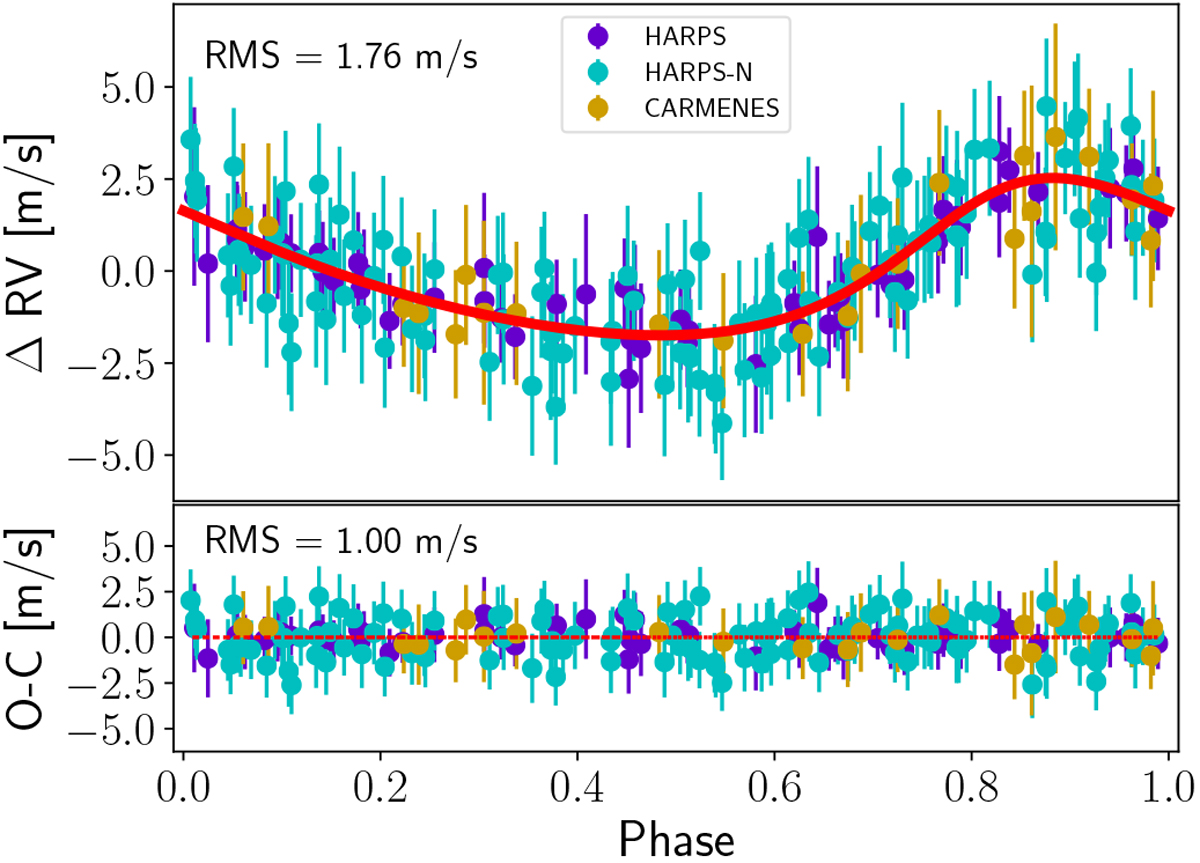
Top: phase-folded curve of the RV time series using the GJ 740 b orbital period after subtracting the long-term signal and the rotation period. The jitter terms of each spectrograph have been added to the original RV errors. The red solid line represents the planetary model. Bottom: residuals after subtracting the model.
Current usage metrics show cumulative count of Article Views (full-text article views including HTML views, PDF and ePub downloads, according to the available data) and Abstracts Views on Vision4Press platform.
Data correspond to usage on the plateform after 2015. The current usage metrics is available 48-96 hours after online publication and is updated daily on week days.
Initial download of the metrics may take a while.