Fig. 4
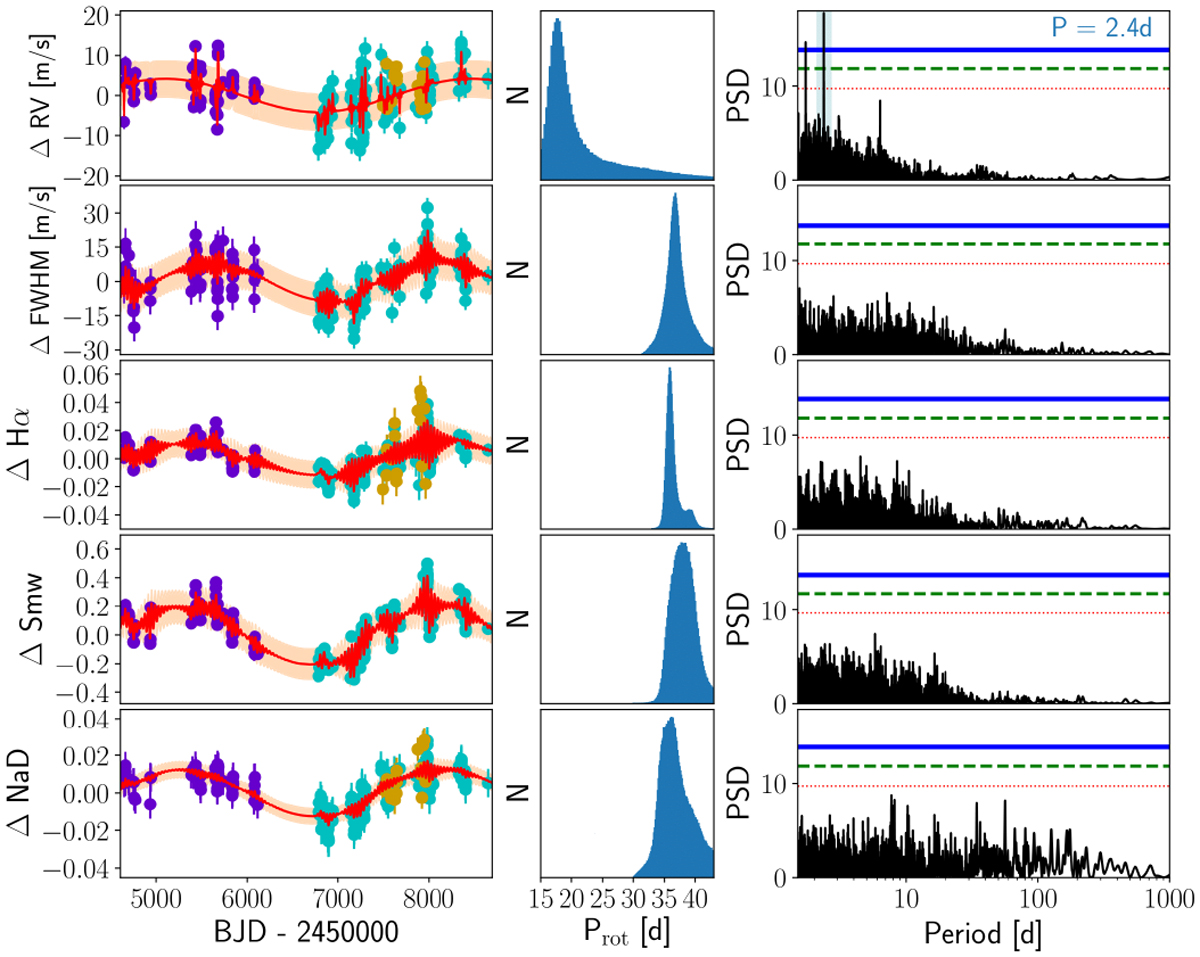
Analysis of the rotation signal. Left: RV, FWHM, Hα, Smw, and NaD time series with their respective model of the long-term signal and the rotation signal. The shaded regions indicate the 1σ confidence band of the GP model. Center: posterior distribution for the periodicity of the rotation signal. Right: periodograms of the residuals after subtracting the model. The blue, green, and red horizontal lines indicate the 0.1, 1, and 10% FAP levels, respectively. The highest peak of the periodogram is marked with a blue shaded area.
Current usage metrics show cumulative count of Article Views (full-text article views including HTML views, PDF and ePub downloads, according to the available data) and Abstracts Views on Vision4Press platform.
Data correspond to usage on the plateform after 2015. The current usage metrics is available 48-96 hours after online publication and is updated daily on week days.
Initial download of the metrics may take a while.