Fig. 1
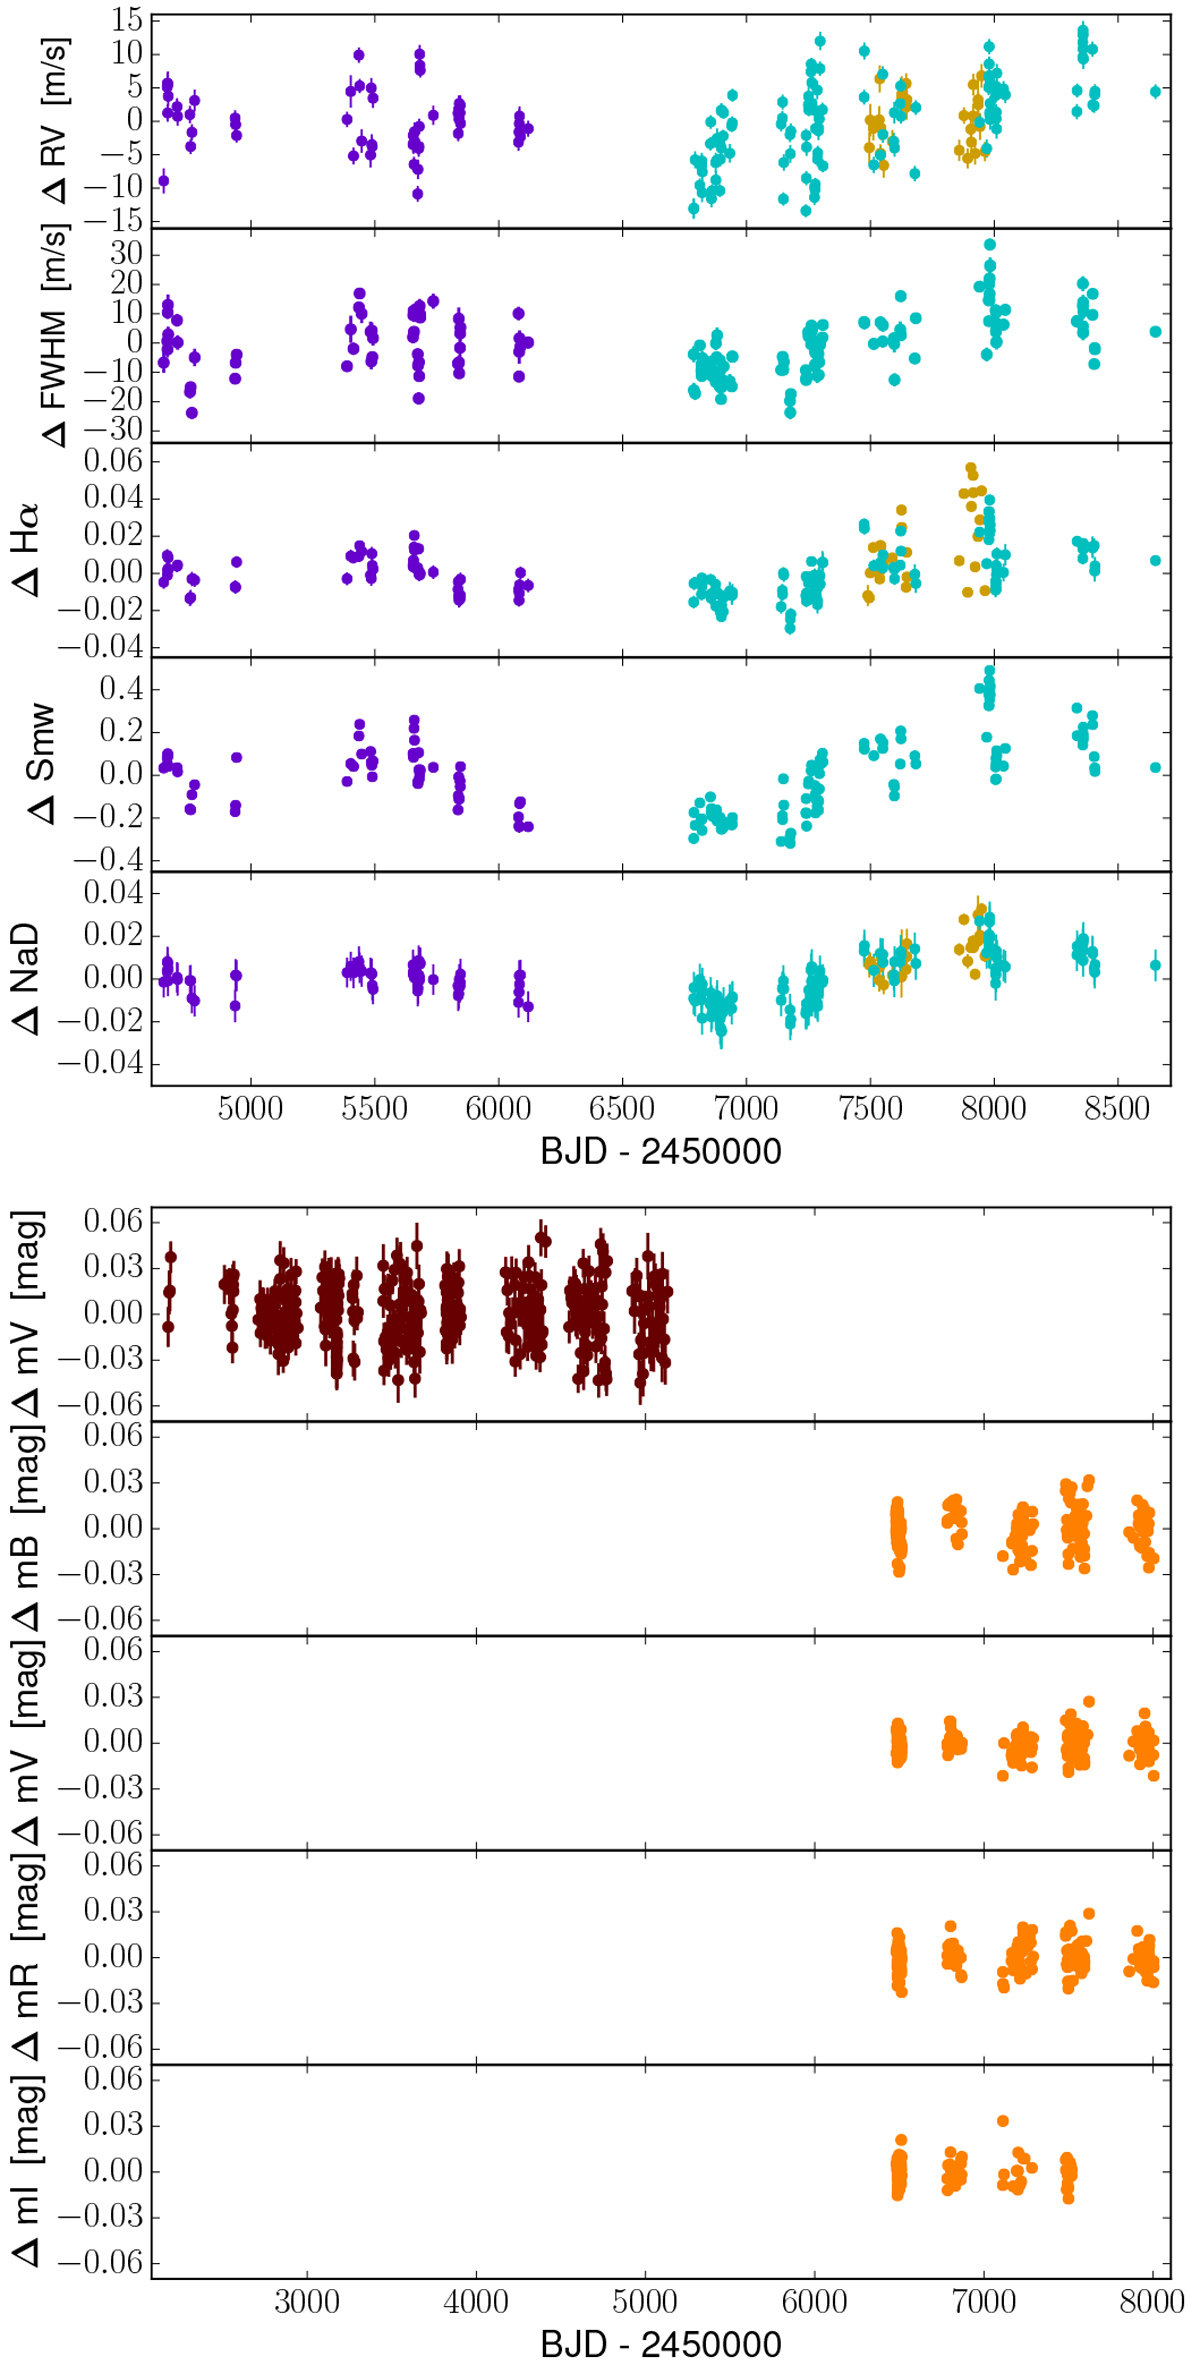
Top: time series of the RV and the chromospheric activity indicators with combined measurements from HARPS (representedin violet), HARPS-N (represented in cyan), and CARMENES (represented in yellow). Bottom: time series of the photometric magnitudes taken with ASAS (represented in dark red) and EXORAP (represented in orange) in the B, V, R, and I filters.
Current usage metrics show cumulative count of Article Views (full-text article views including HTML views, PDF and ePub downloads, according to the available data) and Abstracts Views on Vision4Press platform.
Data correspond to usage on the plateform after 2015. The current usage metrics is available 48-96 hours after online publication and is updated daily on week days.
Initial download of the metrics may take a while.