Fig. 7
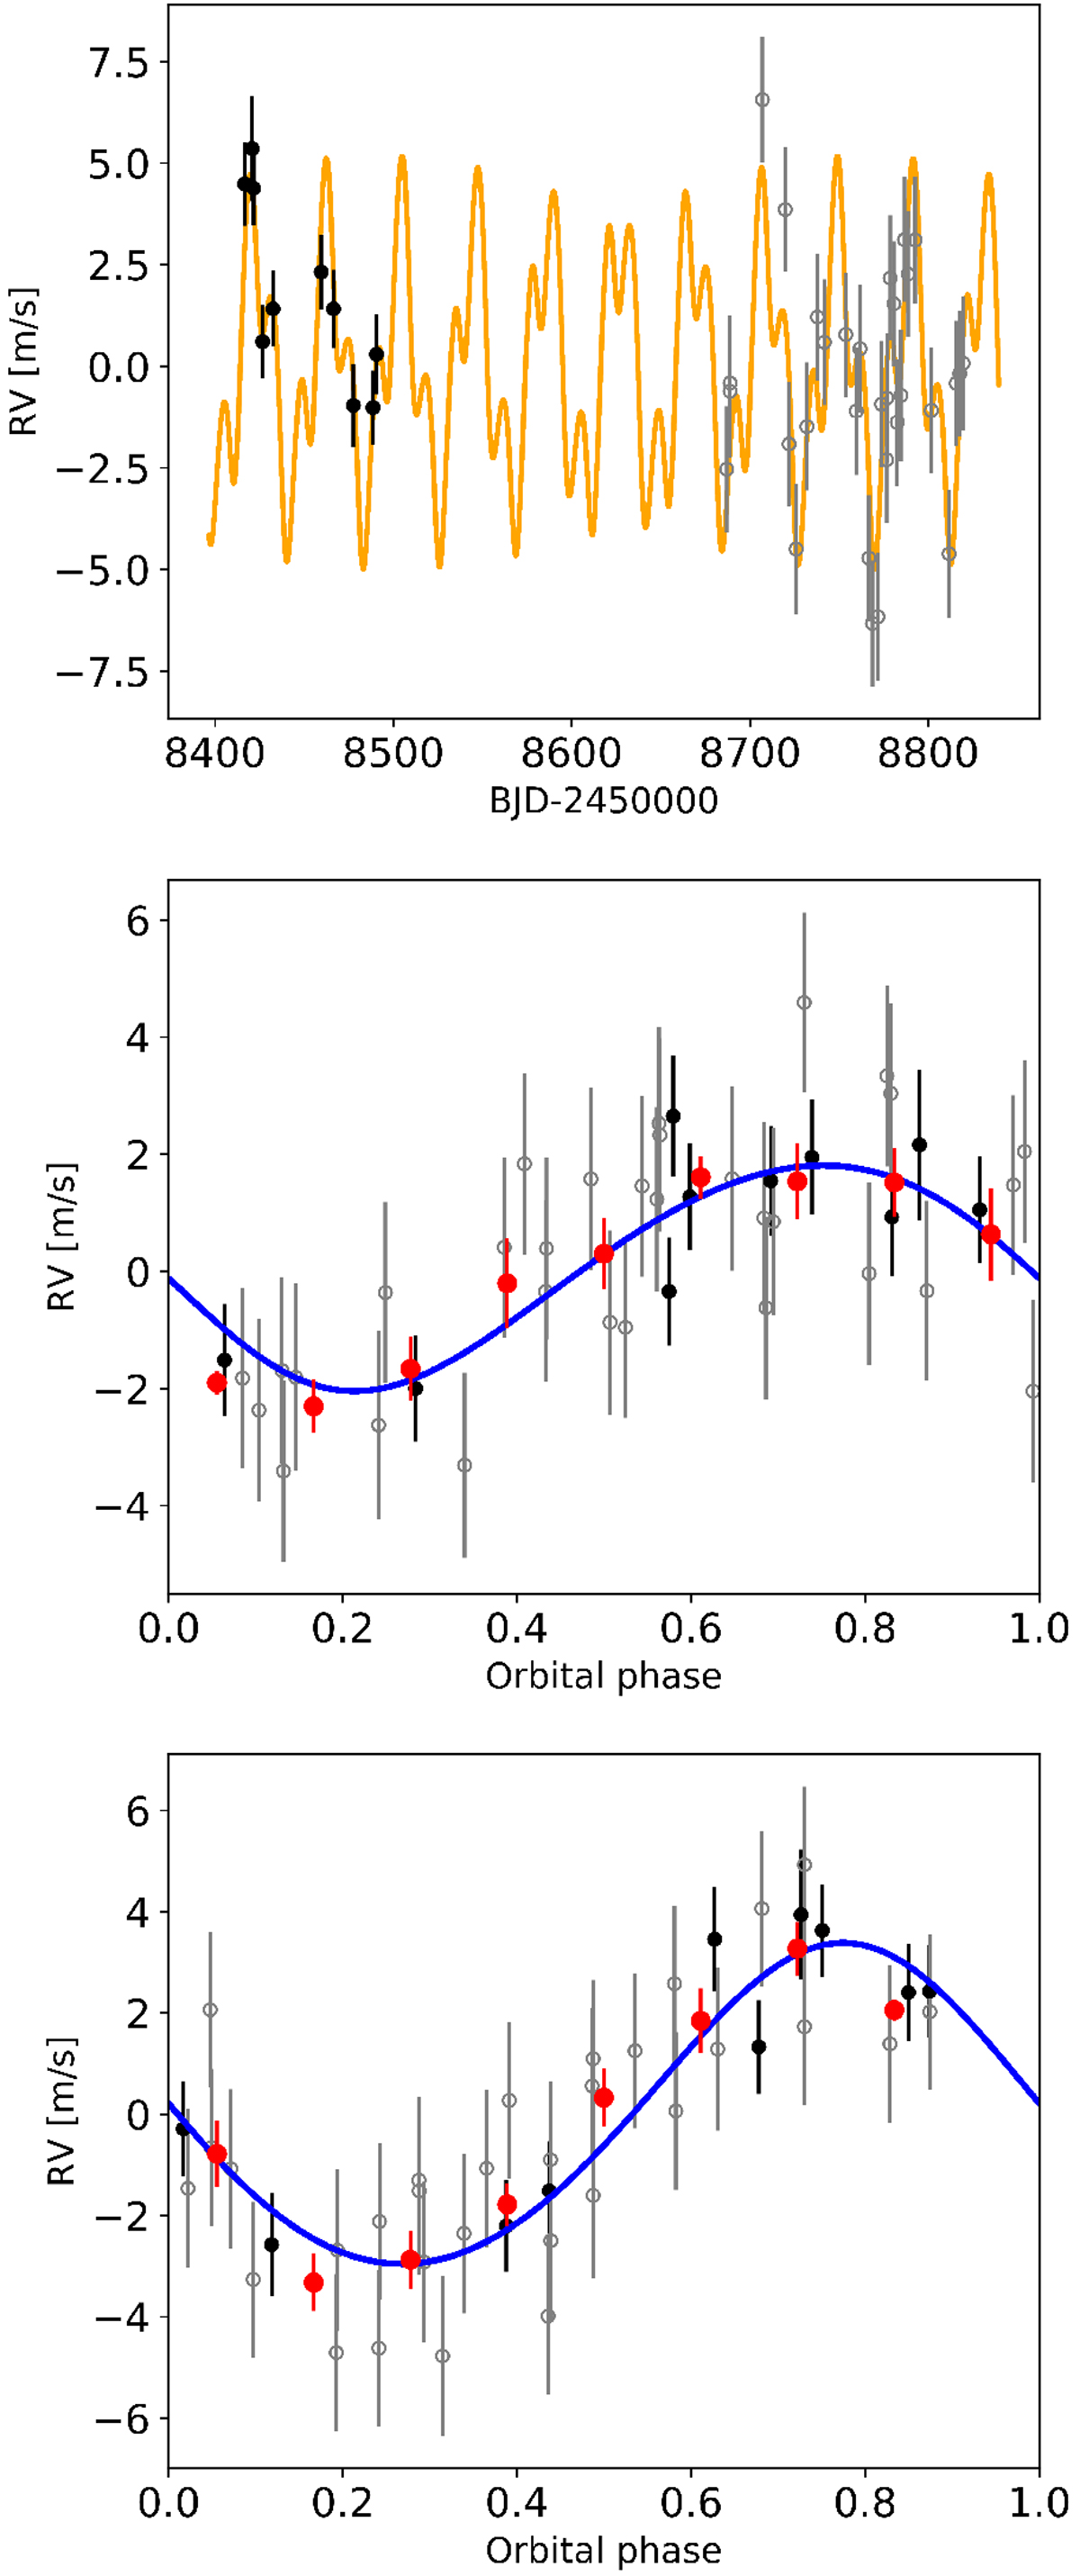
Top: ESPRESSO RV times series for HD 5278 with the best-fit two-planet solution being overplotted (yellow curve) and obtained in the joint ESPRESSO RV and TESS photometry analysis. Black filled and gray open circles correspond to ESPRESSO observations obtained before and after the technical intervention. Center: phase-folded best-fit orbital model for the transiting companion HD 5278 b (blue curve). Individual observations are color-coded as in the top panel, while the large red filled dots show them binned in phase. Bottom: same for the non-transiting companion HD 5278 c. In all panels, formal uncertainties have been inflated adding, in quadrature, the RV jitter values reported in Table 3.
Current usage metrics show cumulative count of Article Views (full-text article views including HTML views, PDF and ePub downloads, according to the available data) and Abstracts Views on Vision4Press platform.
Data correspond to usage on the plateform after 2015. The current usage metrics is available 48-96 hours after online publication and is updated daily on week days.
Initial download of the metrics may take a while.