Fig. 4
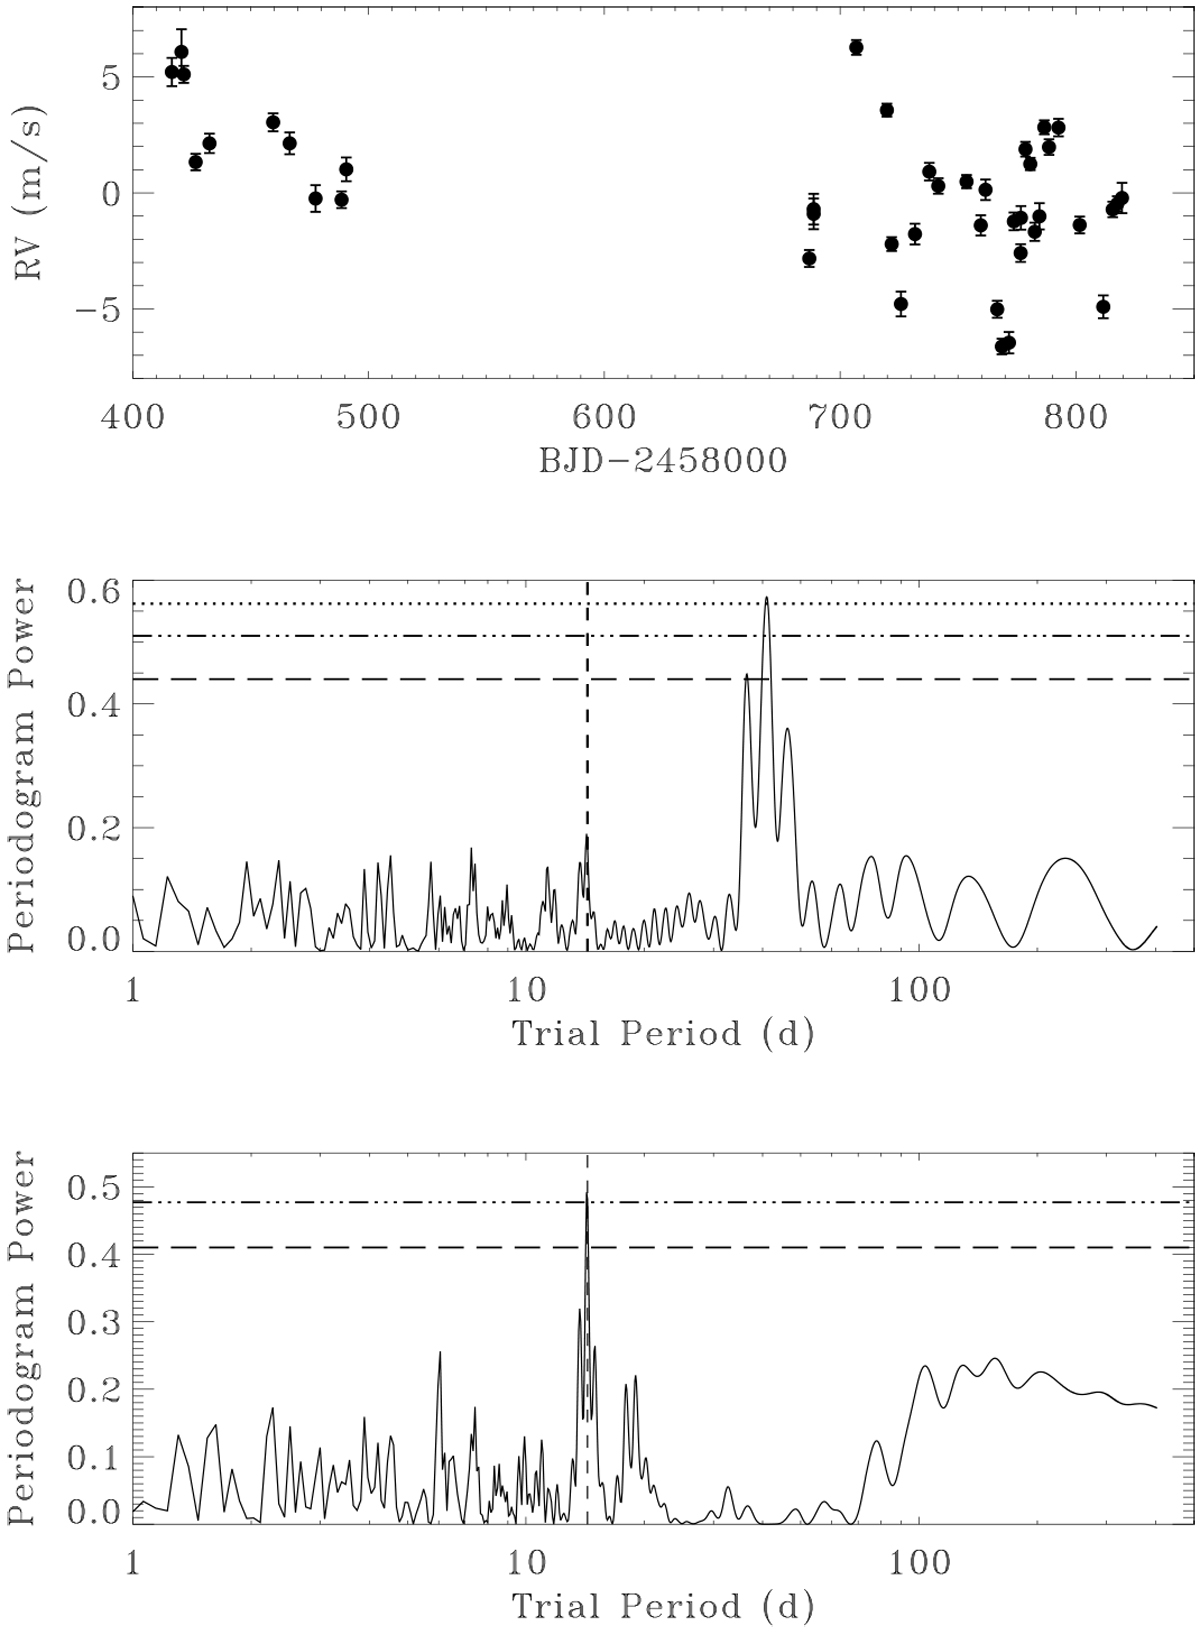
Top: time series of the ESPRESSO RVs for HD 5278. Center: GLS periodogram of the original RV time series. Bottom: GLS periodogram of the residuals after removal of a sinusoid with a 41-day period. The vertical dashed line in the central and lower panels shows the period of the transiting planet candidate from TESS photometry. In the center and bottom panels, the horizontal long-dashed, dashed-dotted, and dotted lines represent 10%, 1%, and 0.1% FAP levels, respectively.
Current usage metrics show cumulative count of Article Views (full-text article views including HTML views, PDF and ePub downloads, according to the available data) and Abstracts Views on Vision4Press platform.
Data correspond to usage on the plateform after 2015. The current usage metrics is available 48-96 hours after online publication and is updated daily on week days.
Initial download of the metrics may take a while.