Free Access
Fig. 3
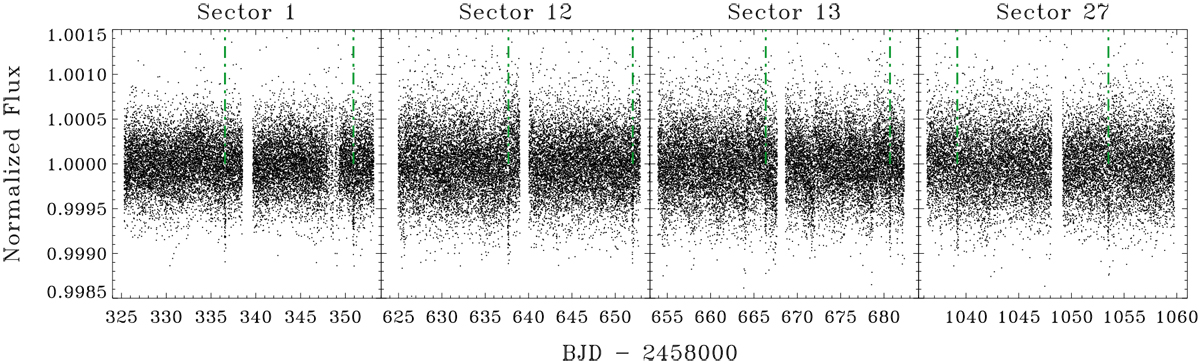
TESS light curve of HD 5278 from sectors 1, 12, 13, and 27. The eight SPOC-detected transits are highlighted with vertical green dashed-dotted lines throughout.
Current usage metrics show cumulative count of Article Views (full-text article views including HTML views, PDF and ePub downloads, according to the available data) and Abstracts Views on Vision4Press platform.
Data correspond to usage on the plateform after 2015. The current usage metrics is available 48-96 hours after online publication and is updated daily on week days.
Initial download of the metrics may take a while.