Free Access
Fig. A.1
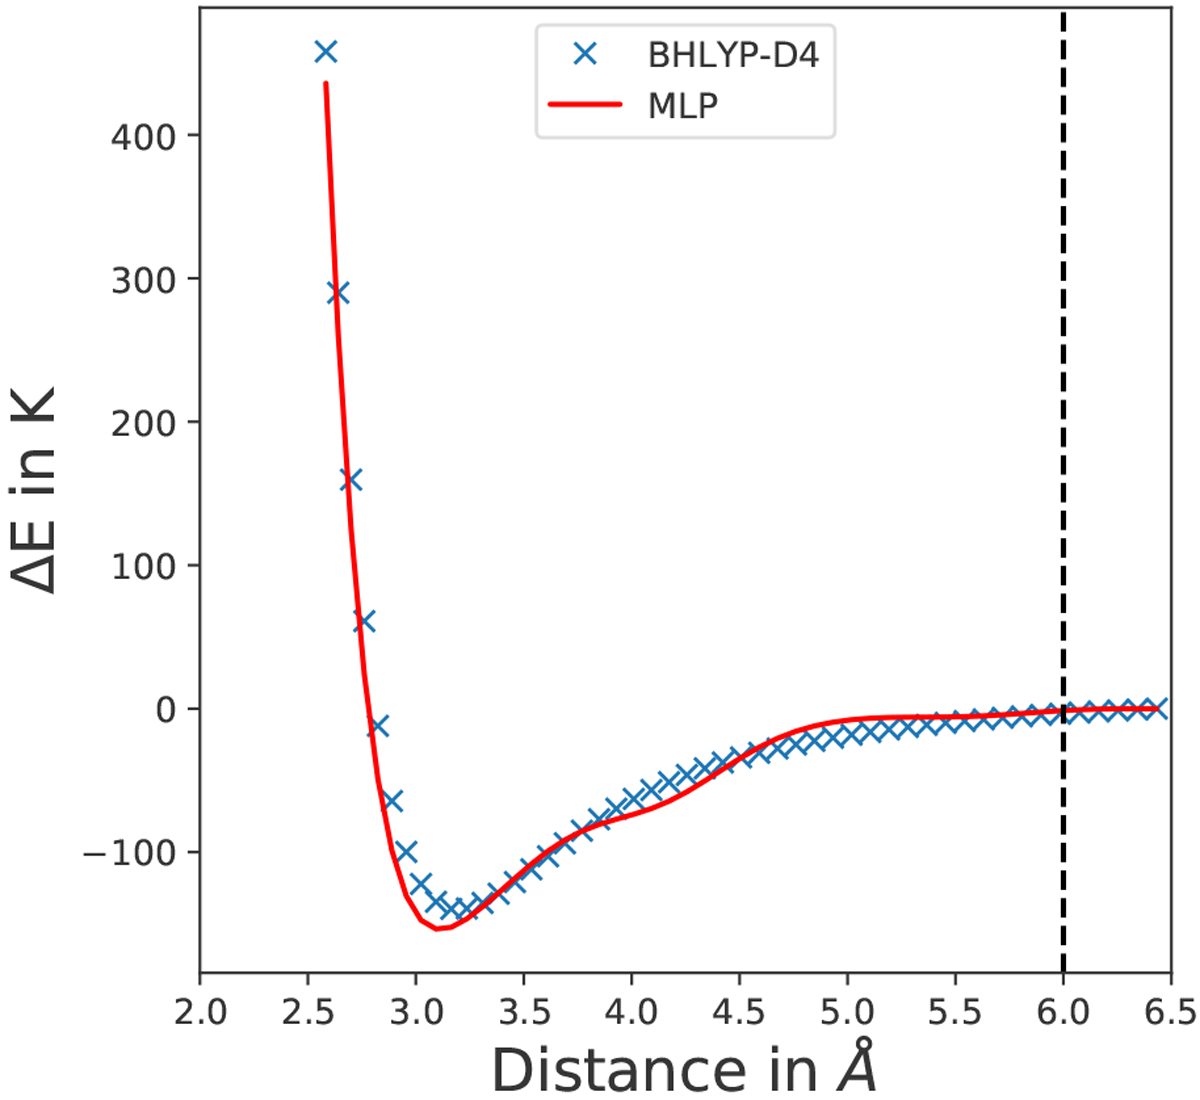
Potential energy profile for a H2 molecule detaching from a 10 CO cluster. Results are presented with DFT and with our MLP potential. The difference between DFT and MLP minima is 14 K, and in the region between 4–0–5.5 Å, the difference is about 10 K. The dotted black line represents the training cutoff.
Current usage metrics show cumulative count of Article Views (full-text article views including HTML views, PDF and ePub downloads, according to the available data) and Abstracts Views on Vision4Press platform.
Data correspond to usage on the plateform after 2015. The current usage metrics is available 48-96 hours after online publication and is updated daily on week days.
Initial download of the metrics may take a while.