Free Access
Fig. 2
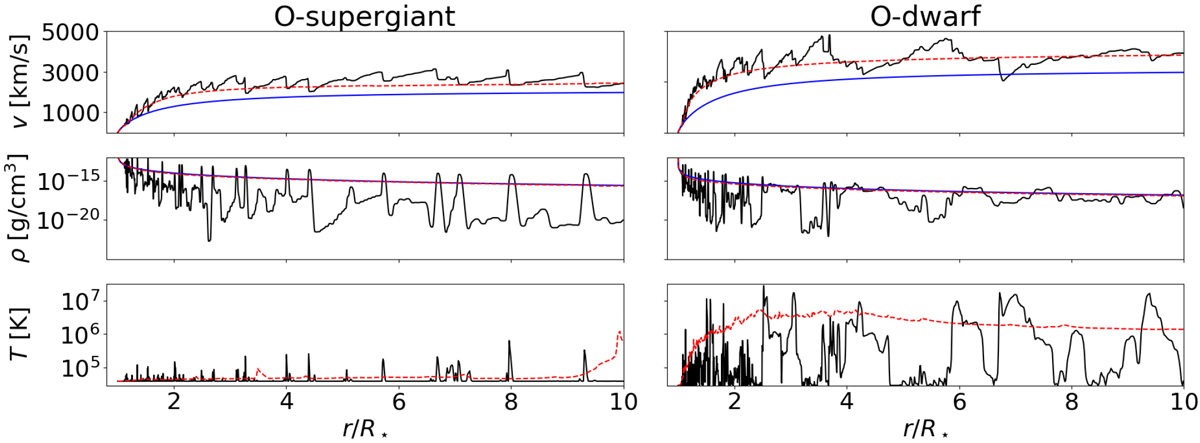
Snapshot of the radial velocity, density, and temperature profiles for the O-supergiant (left) and O-dwarf (right) wind models. The blue lines indicate the corresponding initial CAK models and the red dashed lines are temporal averages taken at each grid cell.
Current usage metrics show cumulative count of Article Views (full-text article views including HTML views, PDF and ePub downloads, according to the available data) and Abstracts Views on Vision4Press platform.
Data correspond to usage on the plateform after 2015. The current usage metrics is available 48-96 hours after online publication and is updated daily on week days.
Initial download of the metrics may take a while.