Fig. 7.
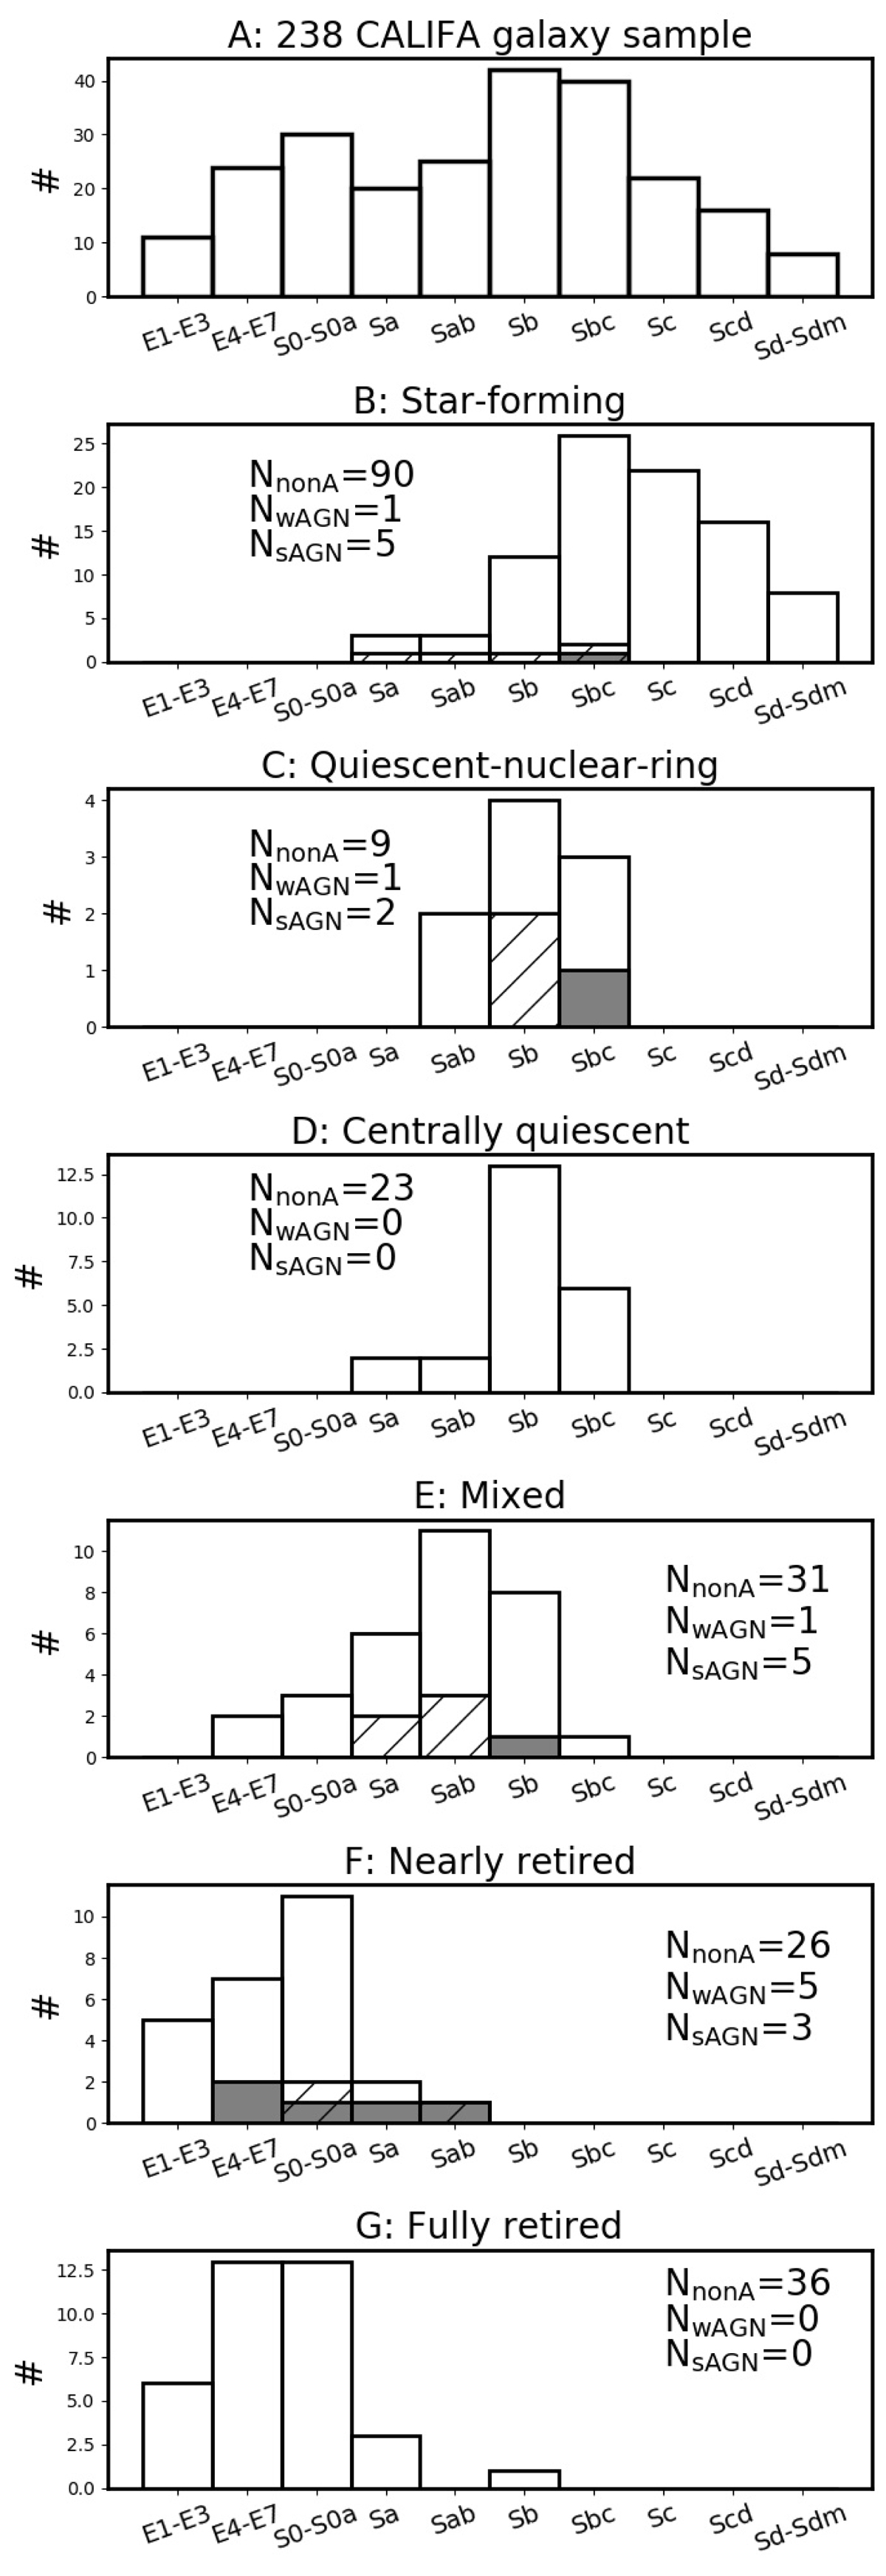
Distributions of the active and non-active galaxies in each quenching stage through Hubble type (panels B-G). The blank bars outline the distribution of the non-active galaxies, while the grey-filled bars and the slashes correspond to the wAGN and sAGN distributions, respectively. Panel A: distribution of the full sample. N gives the number of the galaxies for each nuclear activity group (see Sect. 5.1).
Current usage metrics show cumulative count of Article Views (full-text article views including HTML views, PDF and ePub downloads, according to the available data) and Abstracts Views on Vision4Press platform.
Data correspond to usage on the plateform after 2015. The current usage metrics is available 48-96 hours after online publication and is updated daily on week days.
Initial download of the metrics may take a while.