Fig. 6.
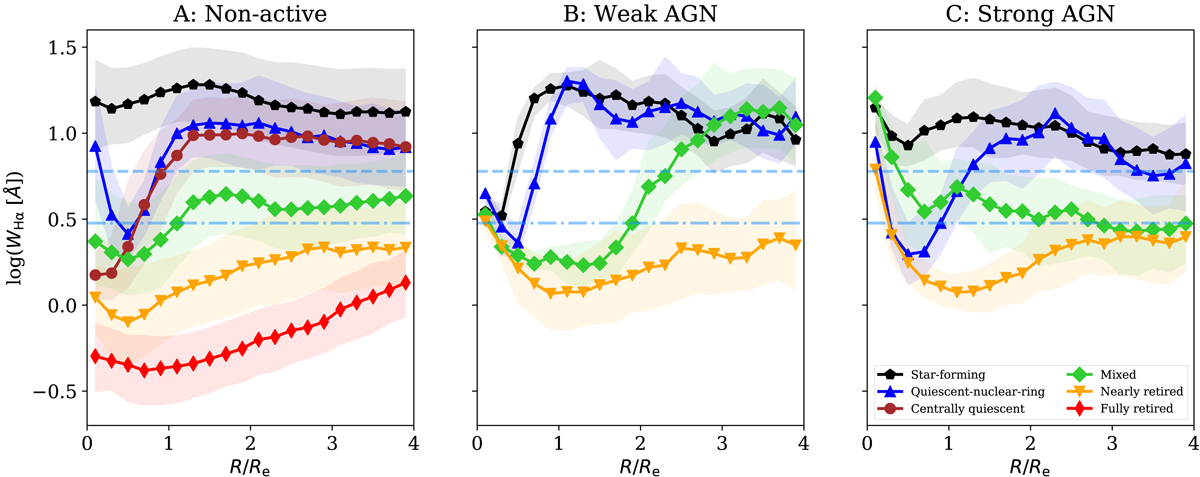
Median radial profiles equivalent width of Hα (WHα) for our sample of galaxies in each quenching stage for non-active (left), weak AGN (middle), and strong AGN (right) classes, normalised by galaxy effective radius Re (Sect. 4). The shaded regions express the 25th and 75th percentiles of the radial distributions. The blue dash-dotted and dashed horizontal lines display WHα = 3 Å and WHα = 6 Å thresholds, respectively. The variation in the WHα profile suggests an ‘inside-out’ star-formation quenching scenario for our sample of galaxies.
Current usage metrics show cumulative count of Article Views (full-text article views including HTML views, PDF and ePub downloads, according to the available data) and Abstracts Views on Vision4Press platform.
Data correspond to usage on the plateform after 2015. The current usage metrics is available 48-96 hours after online publication and is updated daily on week days.
Initial download of the metrics may take a while.