Fig. 11.
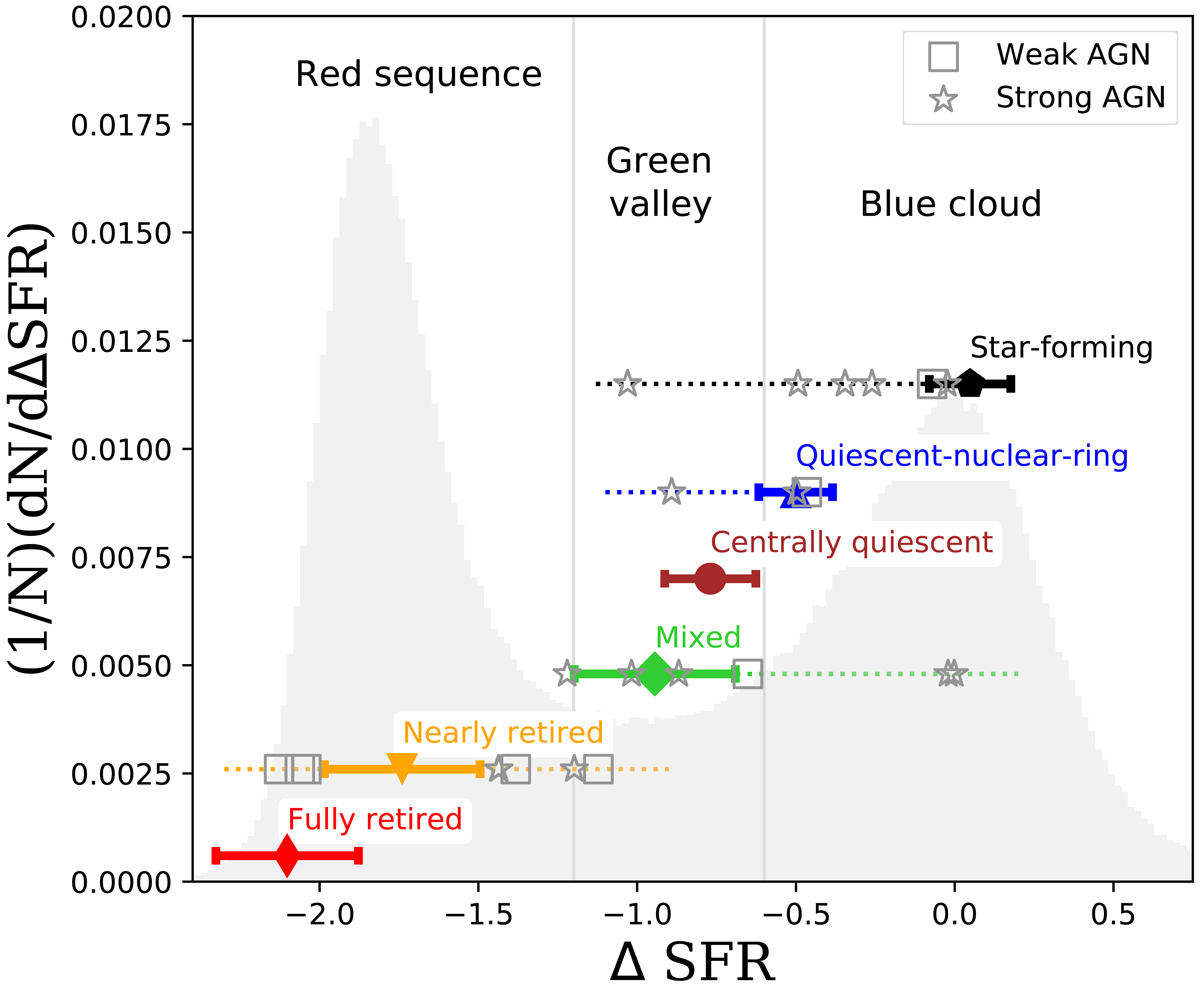
Distribution of Δ SFR for SDSS DR7 galaxies at z ∼ 0 (shaded regions; MPA-JHU catalogue, Kauffmann et al. 2003; Brinchmann et al. 2004; Salim et al. 2007) and for our sample of galaxies. The SDSS y-axis gives the number of the galaxies per given ΔSFR bin (i.e. dN/dΔSFR), normalised to the total number N of the SDSS galaxies, while the y-axis of our sample is arbitrary and chosen here only for representative purposes (due to the smaller number of our galaxies in contrast to the number of the SDSS galaxies). The vertical grey lines indicate the green valley region (adopted values from Bluck et al. 2016). The colour symbols indicate the median Δ SFR distribution for the non-active galaxies of our sample in each QS, while the colour bar indicates the corresponding median absolute deviation. The active galaxies are represented by the grey empty symbols (stars for sAGNs and squares for wAGNs). The horizontal dotted colour lines are plotted to guide the eye for the position of the active galaxies in comparison to the non-active ones for a given QS. Quenching stage galaxies are well divided through Δ SFR, suggesting that the QS represents a certain evolutionary phase from the life cycle of the galaxy (see Sect. 6.1).
Current usage metrics show cumulative count of Article Views (full-text article views including HTML views, PDF and ePub downloads, according to the available data) and Abstracts Views on Vision4Press platform.
Data correspond to usage on the plateform after 2015. The current usage metrics is available 48-96 hours after online publication and is updated daily on week days.
Initial download of the metrics may take a while.