Fig. 10.
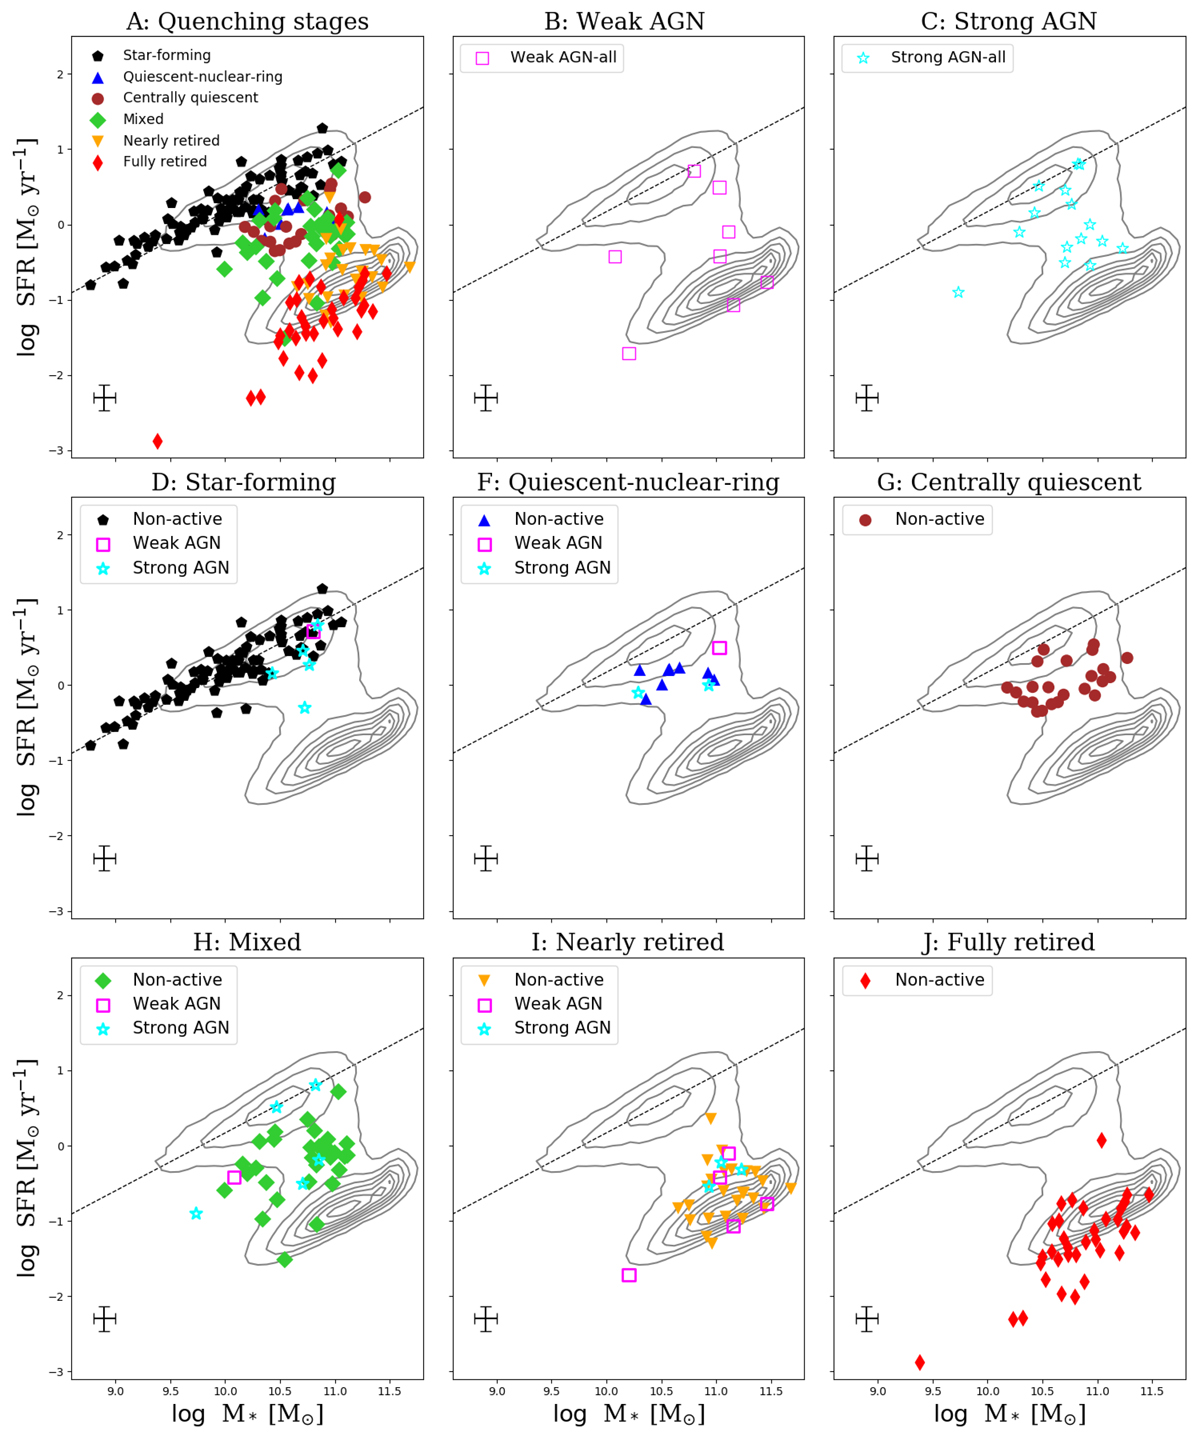
SFR-M* for our sample of CALIFA galaxies, considering their quenching stages and nuclear activities (see Sect. 6.1). All active and non-active galaxies through quenching stage are presented in panel A. Panels B and C: galaxies that host a weak or strong AGN (respectively), independently of their quenching stage. Panels D–J: galaxies in a given quenching stage, where the filled symbols represent the non-active galaxies, while the empty symbols correspond to the active galaxies: wAGN (magenta squares) or sAGN (cyan stars). The dashed line indicates the SFMS using the fit of Elbaz et al. (2007). The grey contours represent the SDSS DR7 population for reference from the MPA-JHU catalogue (Kauffmann et al. 2003; Brinchmann et al. 2004; Salim et al. 2007). The error bars in the panels represent the typical uncertainties on the stellar masses and the SFRs, adopted from Cid Fernandes et al. (2014) and González Delgado et al. (2017), respectively. The degree of star-formation quenching increases along the present EL-pattern sequence from star-forming to fully retired. For a given QS, the active galaxies occupy the same domain on the SFR-M* diagram as the non-active ones.
Current usage metrics show cumulative count of Article Views (full-text article views including HTML views, PDF and ePub downloads, according to the available data) and Abstracts Views on Vision4Press platform.
Data correspond to usage on the plateform after 2015. The current usage metrics is available 48-96 hours after online publication and is updated daily on week days.
Initial download of the metrics may take a while.