Fig. 7.
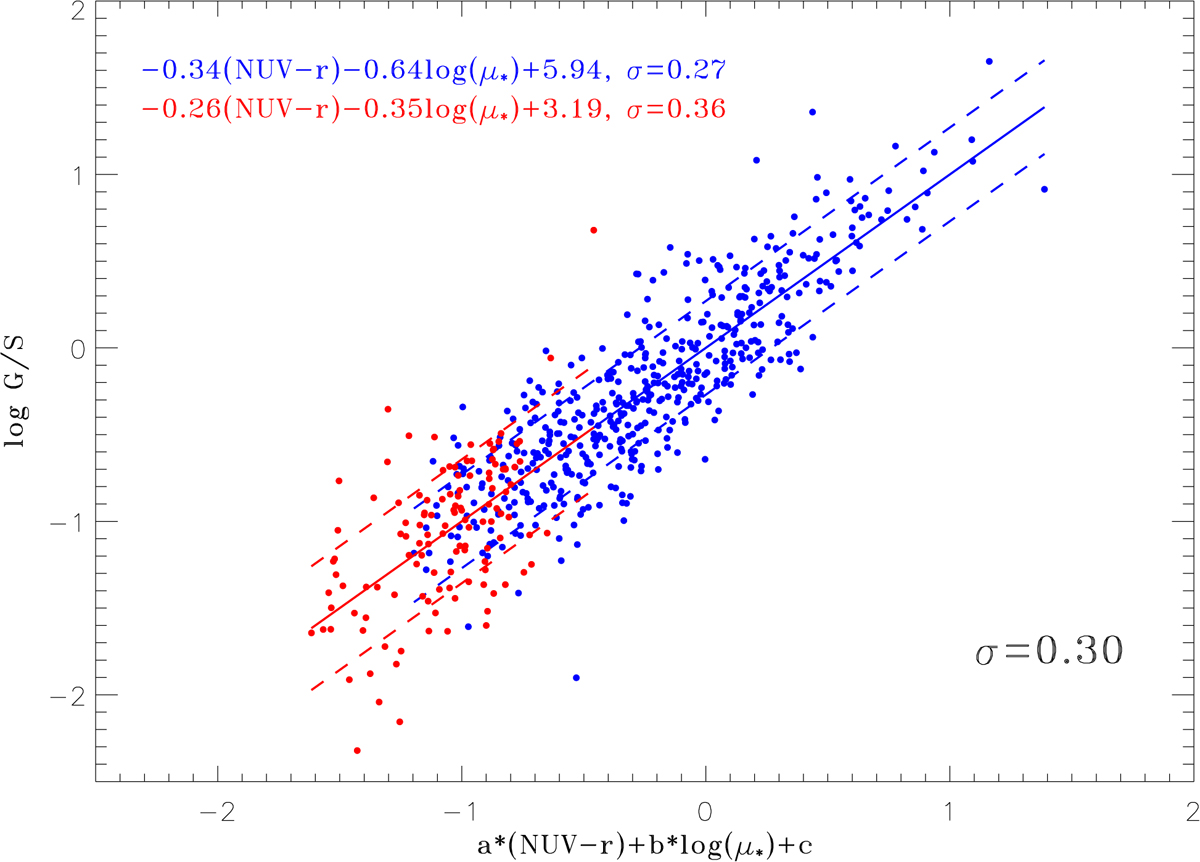
Relation between the H I gas fraction and the linear combination of NUV − r colour and stellar surface mass density (μ*) in the SDSS-z band. The low-z calibrating sample has been divided into two sub-samples according to NUV − r colour: The red points are galaxies with (NUV − r) > 3.5, and the blue points are galaxies with (NUV − r) < 3.5. The fitting parameters are labelled at the top left of the figure.
Current usage metrics show cumulative count of Article Views (full-text article views including HTML views, PDF and ePub downloads, according to the available data) and Abstracts Views on Vision4Press platform.
Data correspond to usage on the plateform after 2015. The current usage metrics is available 48-96 hours after online publication and is updated daily on week days.
Initial download of the metrics may take a while.