Fig. 6.
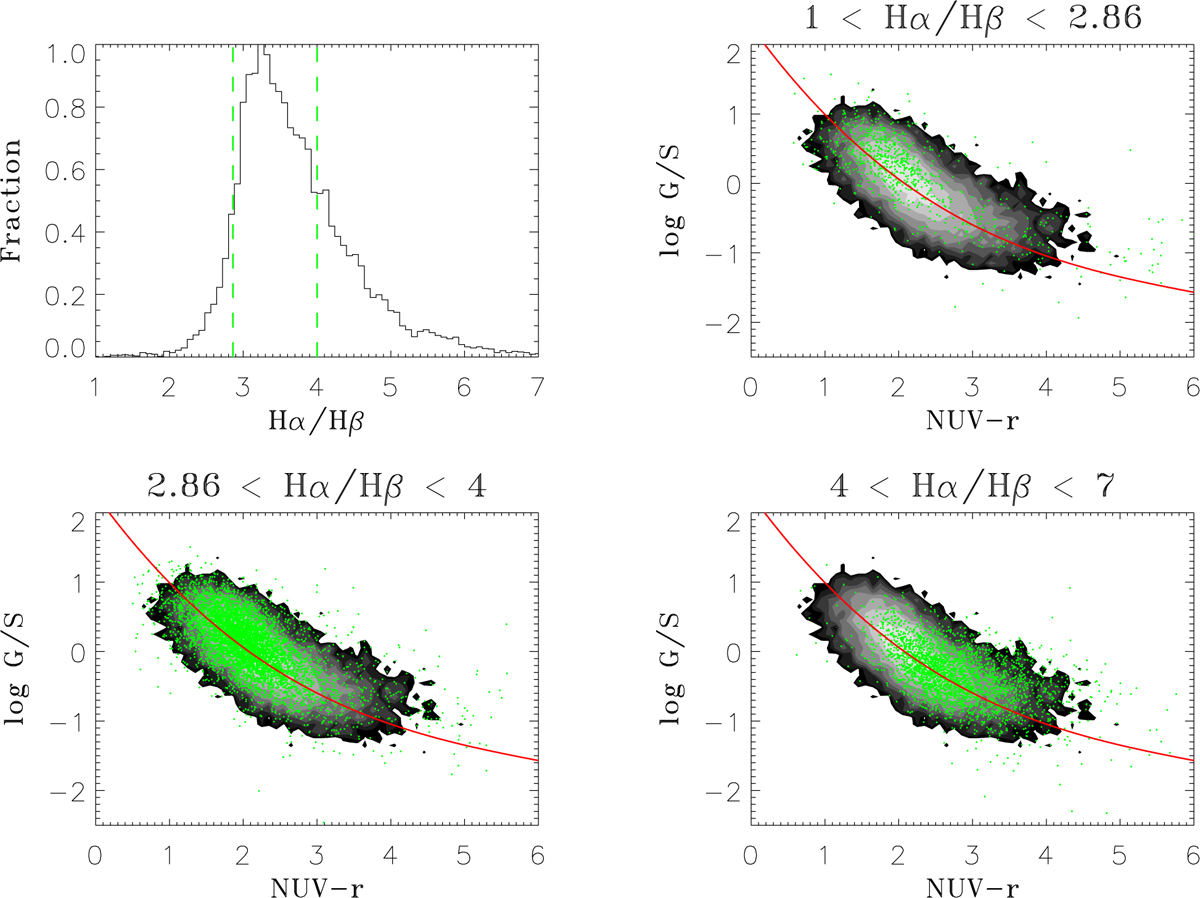
Effect of dust attenuation on the relation between MHI/M* and NUV − r colour. The distribution of the Hα-to-Hβ ratio of the α.100_spec sample is shown in the top-left panel. The dashed green lines indicate the division of the sample into three sub-samples. In the other panels, the three sub-samples are shown as green dots in the MHI/M* vs. NUV − r diagram. Similar to the middle panel in Fig. 5, the black-and-white contours represent the final ALFALFA 100% catalogue (α.100), while the solid red line is the relation described in Eq. (4). As can be seen, galaxies of different dust contents are shifted along the derived relation, not displaced away from it.
Current usage metrics show cumulative count of Article Views (full-text article views including HTML views, PDF and ePub downloads, according to the available data) and Abstracts Views on Vision4Press platform.
Data correspond to usage on the plateform after 2015. The current usage metrics is available 48-96 hours after online publication and is updated daily on week days.
Initial download of the metrics may take a while.