Free Access
Fig. 4.
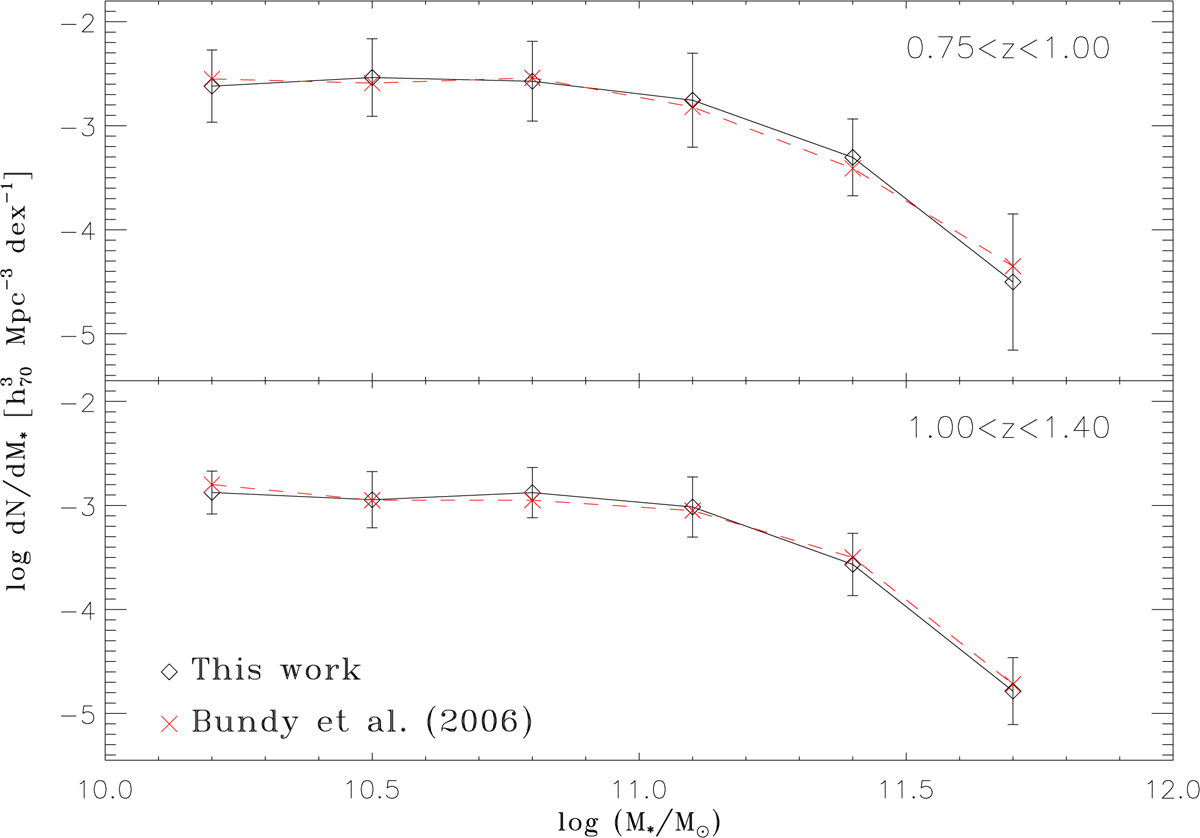
Stellar mass functions at two redshift intervals, as indicated (plotted in black diamonds), compared to the measurements from Bundy et al. (2006; plotted in red crosses).
Current usage metrics show cumulative count of Article Views (full-text article views including HTML views, PDF and ePub downloads, according to the available data) and Abstracts Views on Vision4Press platform.
Data correspond to usage on the plateform after 2015. The current usage metrics is available 48-96 hours after online publication and is updated daily on week days.
Initial download of the metrics may take a while.