Fig. 3.
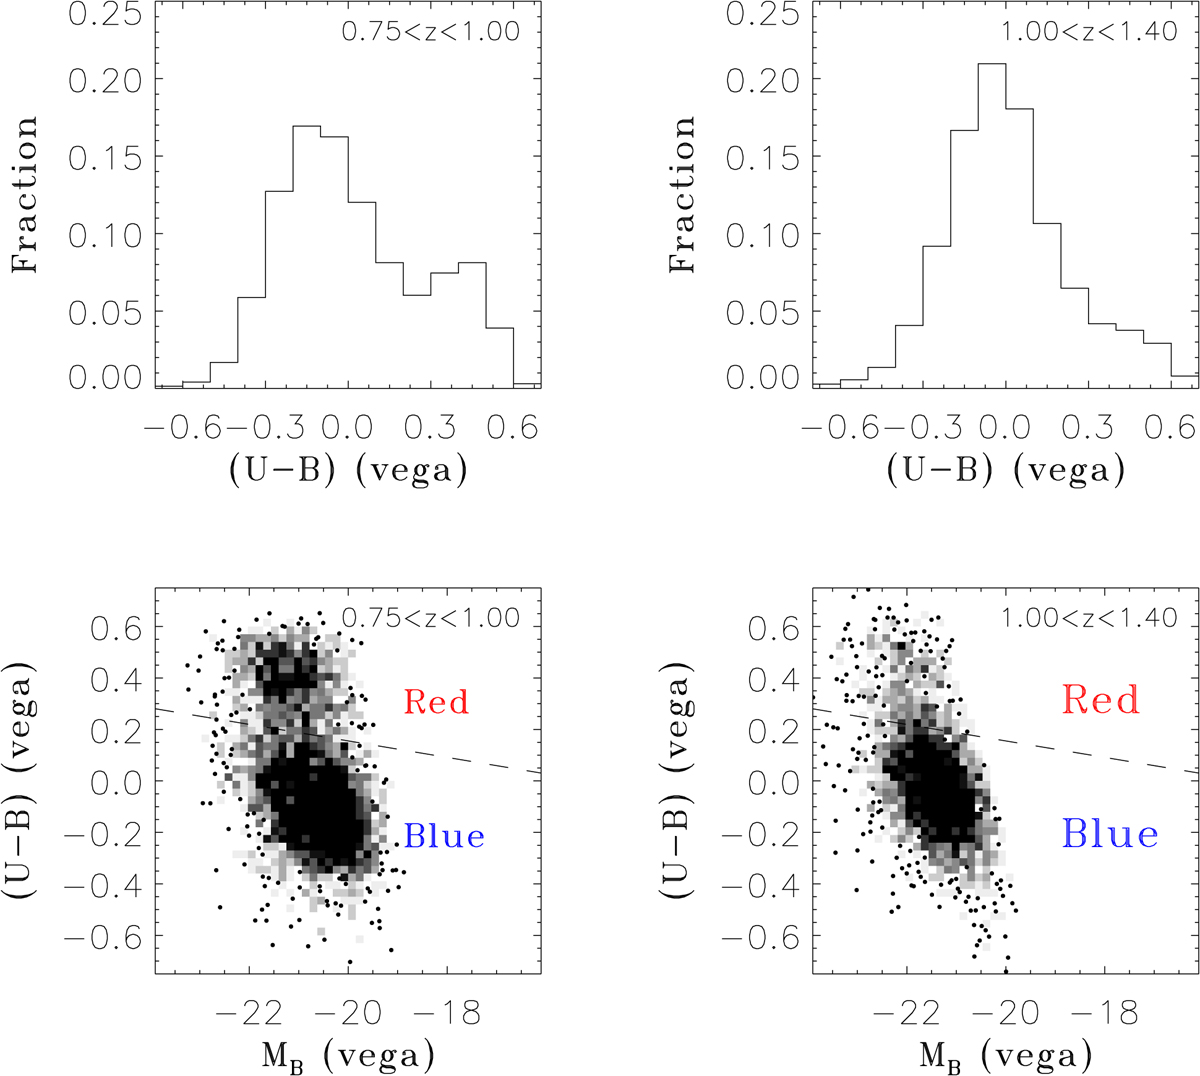
Histograms of the rest-frame U − B colour (top panels) and diagrams of U − B vs. B-band absolute magnitude (lower panels) shown for DEEP2 galaxies in two successive redshift intervals: 0.75 < z < 1 (left-hand panels) and 1 < z < 1.4 (right-hand panels). The dashed line in the lower panels is the luminosity-dependent colour divider employed by van Dokkum (2008), which is used in this work to classify our galaxies into red and blue populations. Magnitudes plotted in this figure are in the Vega system.
Current usage metrics show cumulative count of Article Views (full-text article views including HTML views, PDF and ePub downloads, according to the available data) and Abstracts Views on Vision4Press platform.
Data correspond to usage on the plateform after 2015. The current usage metrics is available 48-96 hours after online publication and is updated daily on week days.
Initial download of the metrics may take a while.