Free Access
Fig. 13.
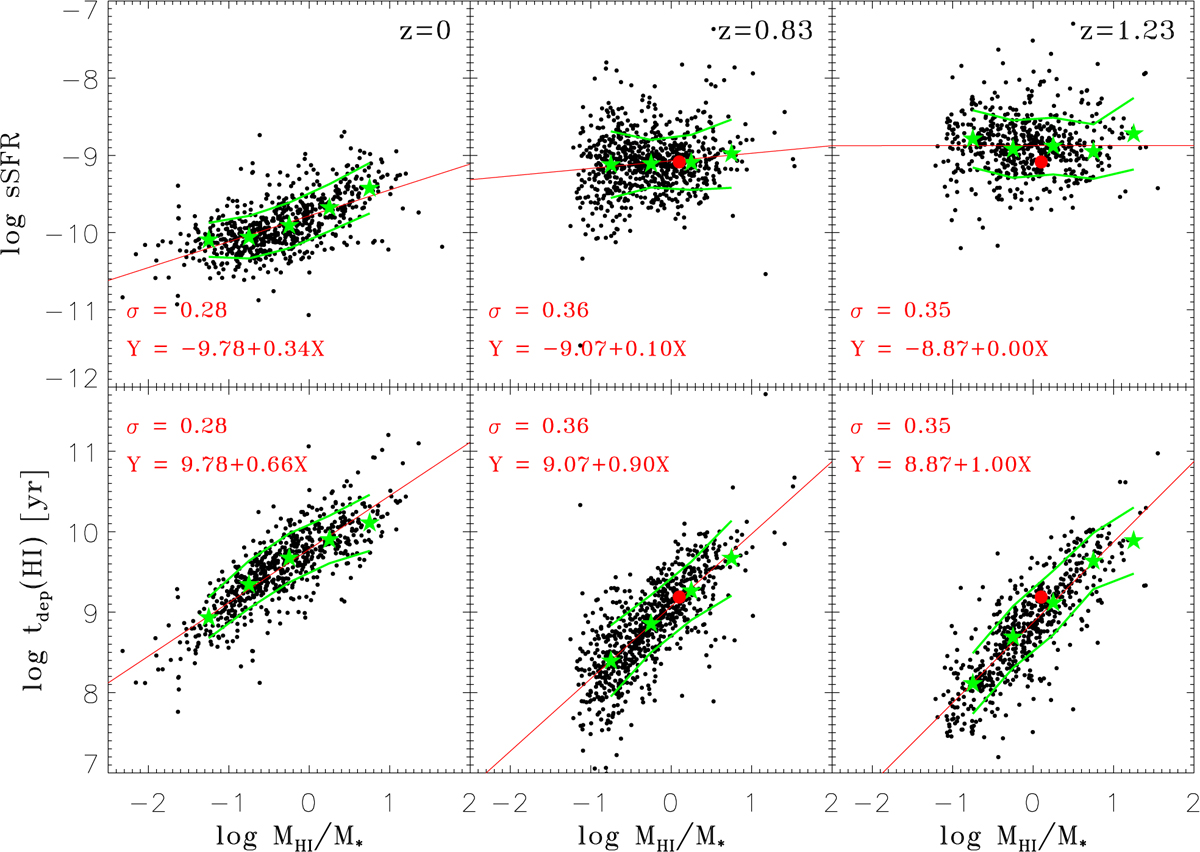
Correlations of sSFRs and H I gas depletion times with the H I-to-stellar mass ratio plotted for the same sets of galaxies with the same symbols and lines as in the previous figure.
Current usage metrics show cumulative count of Article Views (full-text article views including HTML views, PDF and ePub downloads, according to the available data) and Abstracts Views on Vision4Press platform.
Data correspond to usage on the plateform after 2015. The current usage metrics is available 48-96 hours after online publication and is updated daily on week days.
Initial download of the metrics may take a while.