Fig. 12.
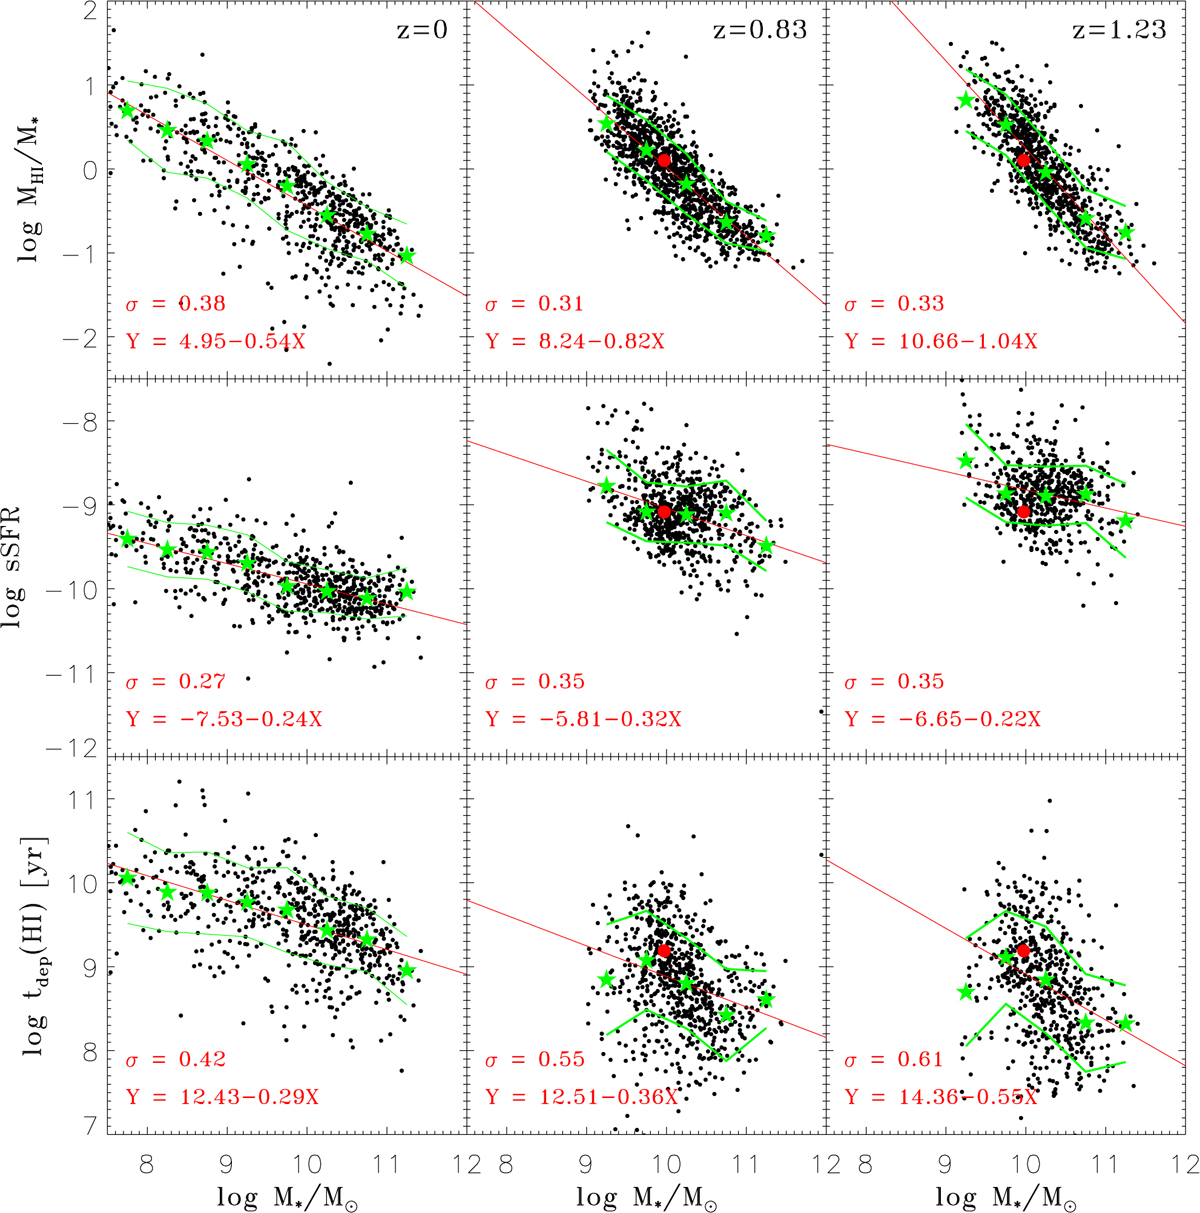
H I-to-stellar mass ratio (MHI/M*; top panels), sSFR (SFR/M*; second row of panels), and H I gas depletion time (MHI/SFR; bottom panels) plotted as a function of stellar mass, for the low-z calibrating sample (left) and the DEEP2 galaxies at the two higher redshifts (centre and right-hand panels). The small black dots are for the low-z calibrating sample or the blue galaxies at high redshifts, and the red line in each panel shows the best fitting with a linear relation. The stars and the two solid lines plotted in green show the median and 1σ scatter for a number of stellar mass bins, respectively. For comparison, the mean measurements of star-forming galaxies at redshift z ∼ 1 by Chowdhury et al. (2020) are plotted as filled red circles.
Current usage metrics show cumulative count of Article Views (full-text article views including HTML views, PDF and ePub downloads, according to the available data) and Abstracts Views on Vision4Press platform.
Data correspond to usage on the plateform after 2015. The current usage metrics is available 48-96 hours after online publication and is updated daily on week days.
Initial download of the metrics may take a while.