Fig. 10.
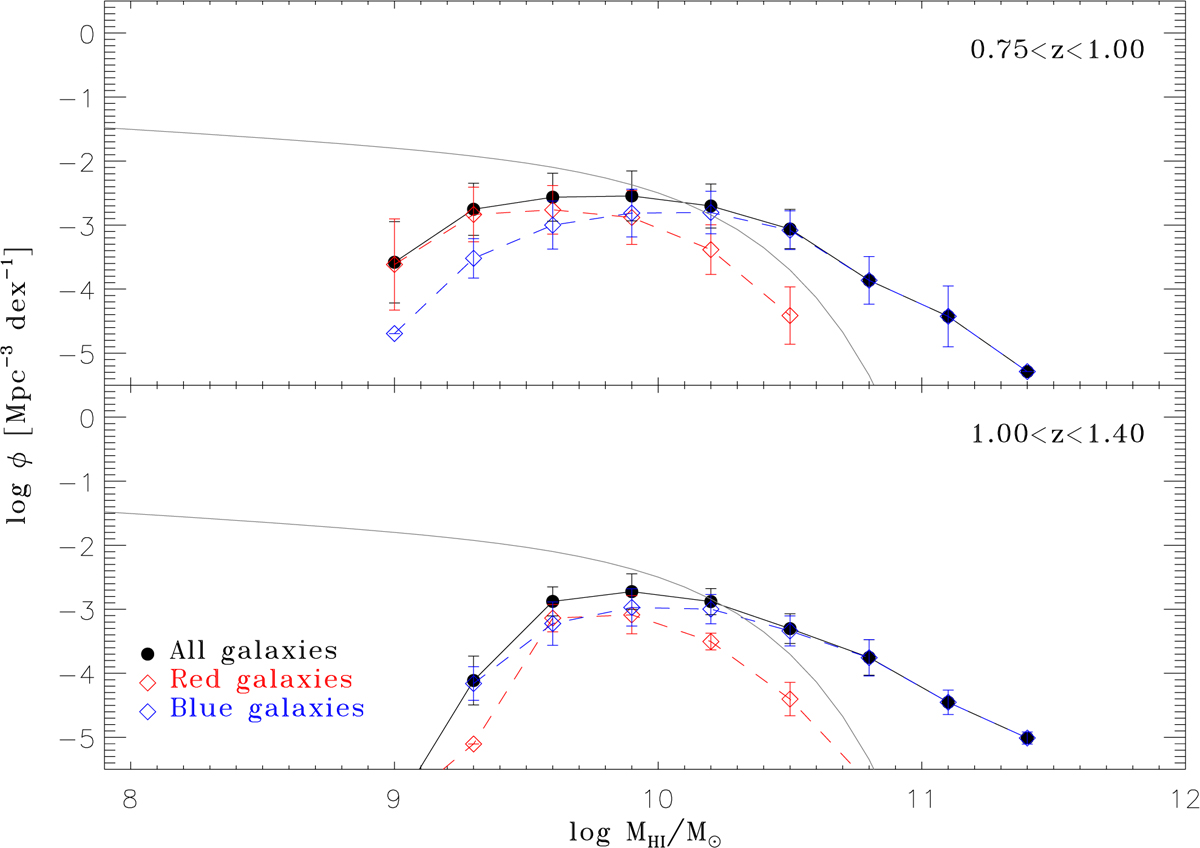
H I mass functions estimated from DEEP2 for the two indicated redshift intervals plotted with solid black circles connected by a solid line for the whole sample, and in red (blue) diamonds connected by a dashed line for the red (blue) galaxy sub-samples. For comparison, the HIMF at z = 0 from α.100 is shown as solid grey lines.
Current usage metrics show cumulative count of Article Views (full-text article views including HTML views, PDF and ePub downloads, according to the available data) and Abstracts Views on Vision4Press platform.
Data correspond to usage on the plateform after 2015. The current usage metrics is available 48-96 hours after online publication and is updated daily on week days.
Initial download of the metrics may take a while.