Fig. 7
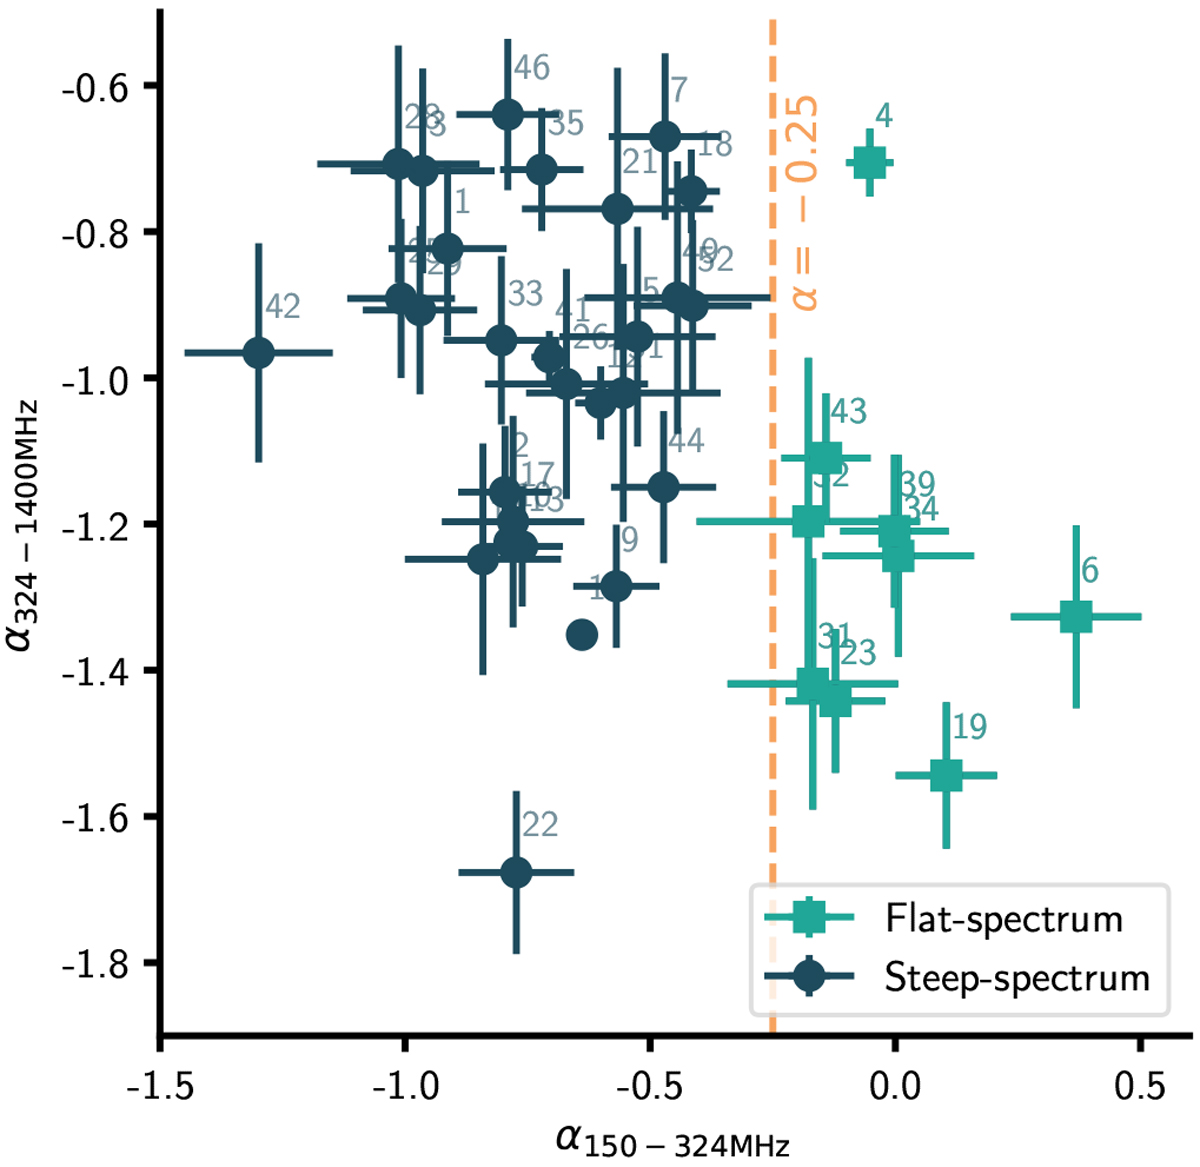
Radio colour–colour plot showing the low-frequency (150 MHz –324 MHz) spectral slope on the x-axis and the high-frequency (324 MHz–1.4 GHz) spectral slope on the y-axis. The dashed line indicates αlow =−0.25, the cutoff above which we define sources to have extremely flat low-frequency spectra. Sources above this threshold are marked with squares in the plots throughout this paper. Sources are numbered with the IDs assigned in this study, as detailed in Table 1.
Current usage metrics show cumulative count of Article Views (full-text article views including HTML views, PDF and ePub downloads, according to the available data) and Abstracts Views on Vision4Press platform.
Data correspond to usage on the plateform after 2015. The current usage metrics is available 48-96 hours after online publication and is updated daily on week days.
Initial download of the metrics may take a while.