Fig. 6
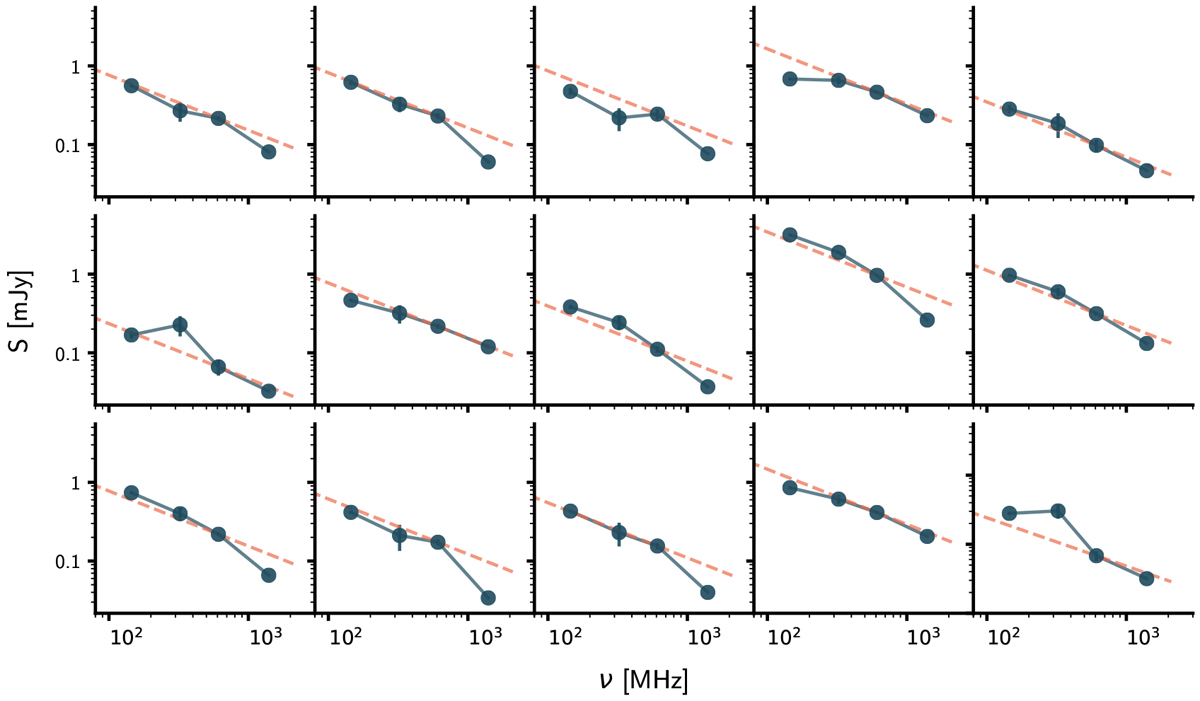
Examples of radio SEDs from our sample, with data at 150 MHz from LOFAR, 324 MHz and 1.4 GHz from the JVLA, and 610 MHz from the GMRT (see Sect. 2.3). There is a range of luminosities and spectral shapes. Orange lines show a simple power law with spectral index α = −0.7 normalised to the 610 MHz point as a reference and to demonstrate the spectral curvature present in many of these radio spectra. Error bars are shown but are largely within the size of the plotted points.
Current usage metrics show cumulative count of Article Views (full-text article views including HTML views, PDF and ePub downloads, according to the available data) and Abstracts Views on Vision4Press platform.
Data correspond to usage on the plateform after 2015. The current usage metrics is available 48-96 hours after online publication and is updated daily on week days.
Initial download of the metrics may take a while.